|

AUD/JPY Price Analysis: Bulls gather momentum, consolidation ongoing

  • Daily chart indicators suggest a positive incline; RSI climbs up.
  • Hourly chart indicators flatten out in positive territory, indicating consolidation after recent gains.
  • The pair is seeing signs of bullish exhaustion after recent gains, with eyes set on support around the 103.60-103.80 area.

In Friday's trading session, the AUD/JPY pair soared to the 104.50 region owing to positive momentum, reinforcing expectations of an overall bullish landscape. However, the market's upward trajectory is showing signs of fatigue, and the pair has entered in a consolidation phase.

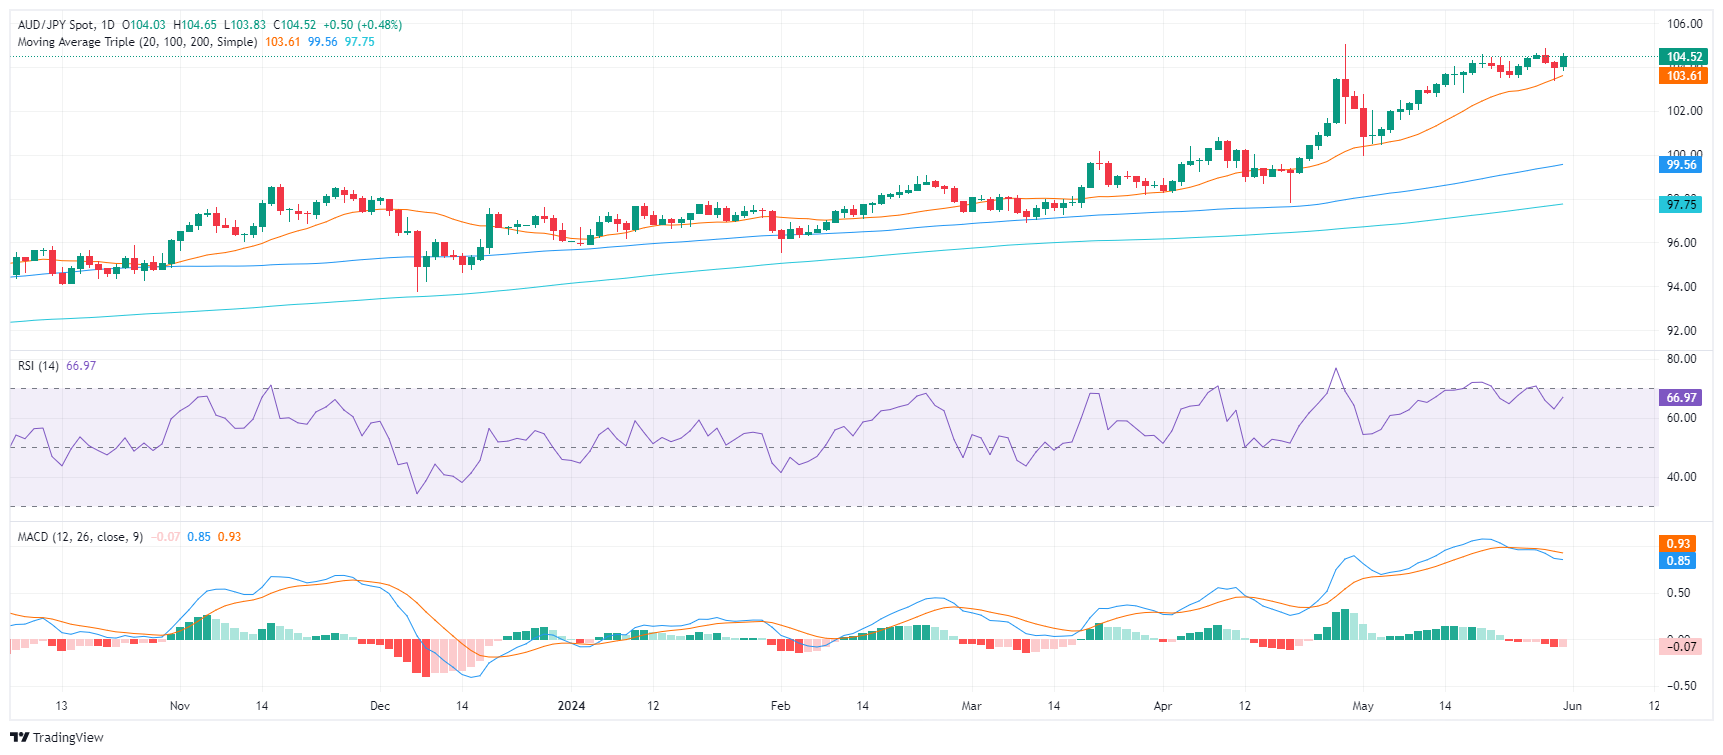
As per the daily chart, the RSI has ascended near to the 70 region, presenting a slight recovery from Wednesday's drop to 67, suggesting a potential halt to the previous downtrend. Corresponding with this, the MACD prints flat red bars, indicating a possible pause in the market's selling traction.

AUD/JPY daily chart

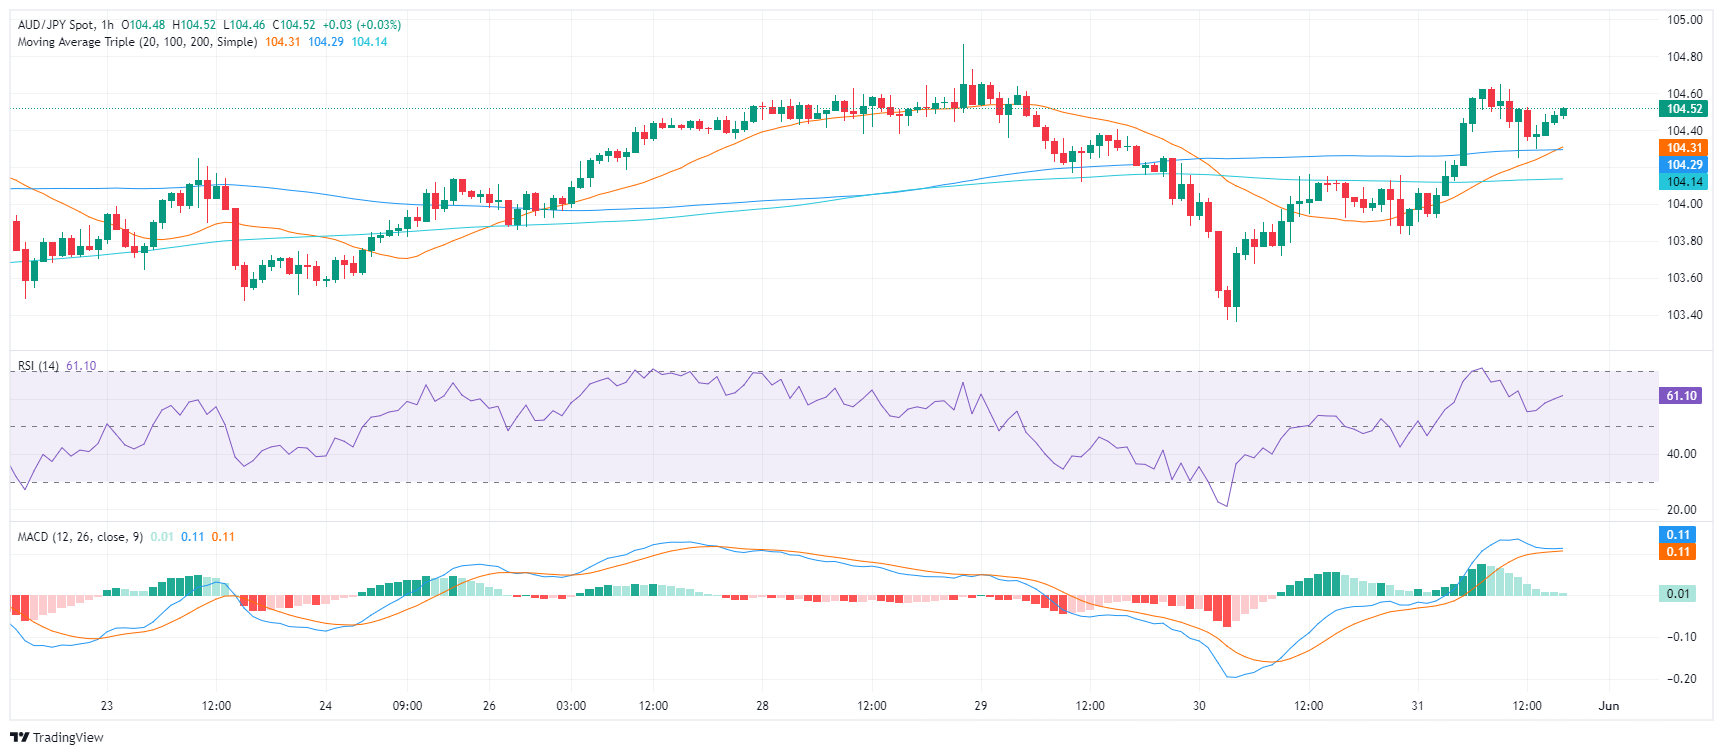
Confirming these dynamics is the hourly chart. The RSI and MACD are greener and have flattened, indicating a potential period of consolidation following the recent rally.

AUD/JPY hourly chart

In retrospect to the session on Thursday, sellers were repelled at the 20-day SMA mark of 103.60 and again on Friday at 103.80. These developments have set a formidable support base around that region, which appears could be leveraged to stabilize the recent gains. Any downturn below the 20-day SMA may risk undermining the short-term bullish atmosphere.

AUD/JPY

Overview
Today last price104.5
Today Daily Change0.48
Today Daily Change %0.46
Today daily open104.02
 
Trends
Daily SMA20103.44
Daily SMA50101.33
Daily SMA10099.48
Daily SMA20097.7
 
Levels
Previous Daily High104.26
Previous Daily Low103.36
Previous Weekly High104.56
Previous Weekly Low103.48
Previous Monthly High105.04
Previous Monthly Low97.78
Daily Fibonacci 38.2%103.7
Daily Fibonacci 61.8%103.91
Daily Pivot Point S1103.5
Daily Pivot Point S2102.98
Daily Pivot Point S3102.6
Daily Pivot Point R1104.4
Daily Pivot Point R2104.77
Daily Pivot Point R3105.29

Author

Patricio Martín

Patricio is an economist from Argentina passionate about global finance and understanding the daily movements of the markets.

More from Patricio Martín
Share:

Editor's Picks

AUD/USD falls to near 0.7100 after slipping below 50-day EMA

AUD/USD depreciates after registering minor gains in the previous day, trading around 0.7120 during the Asian hours. The technical analysis of the daily chart shows the pair consolidating sideways within a rectangle pattern, as neither bulls nor bears gain control. The AUD/USD pair is holding a slight bearish tone however as it sits beneath both the nine-day and 50-day EMAs.

160.00: USD/JPY back near intervention territory after upbeat US jobs report

US Nonfarm Payrolls beat expectations by a wide margin in May, with 172K jobs added. The US Dollar rebounds after the release, helping USD/JPY recover from its intraday lows. Warnings from Japanese authorities continue to limit upside potential near the 160.00 threshold.

Gold targets $4,300 amid stronger Dollar

Gold faces increasing selling interest and navigates the area of three-month lows near the $4,300 mark per troy ounce on Friday. The precious metal’s decline comes as traders assess the stronger-than-expected NFP, while the bid bias in the Greenback and higher US Treasury yields also collaborate with the retracement.

Cardano hits five-year low even as Hoskinson clarifies "break" isn't an exit

Cardano (ADA) price is down 10% at press time on Friday, extending losses over 30% so far this week amid Charles Hoskinson's clarification that "break" isn't an exit.

Week ahead – Fed countdown begins amid US inflation data and geopolitical risks

Fed Chair Warsh’s first meeting approaches as key US inflation data could reshape expectations. Oil prices remain elevated as US-Iran talks continue; tariffs also return to the spotlight. ECB is expected to hike; will it be a one-off move or is July live?

The US economy defies the rules: 100 days into the Oil shock and the recession signal is still missing

More than three months after the start of the Iran war and the resulting disruption to global energy markets, the US economy continues to display remarkable resilience. The conflict has triggered a sharp rise in Oil prices, reignited inflationary pressures and fueled widespread concerns about a potential economic slowdown.