|

AUD/JPY Price Analysis: Bears deepen losses as pair hits multi-week lows

  • AUD/JPY extends its decline, falling sharply and breaking below the 20-day SMA.
  • RSI remains in negative territory, reflecting intensifying bearish momentum.
  • MACD histogram prints rising red bars, signaling increasing downside pressure.

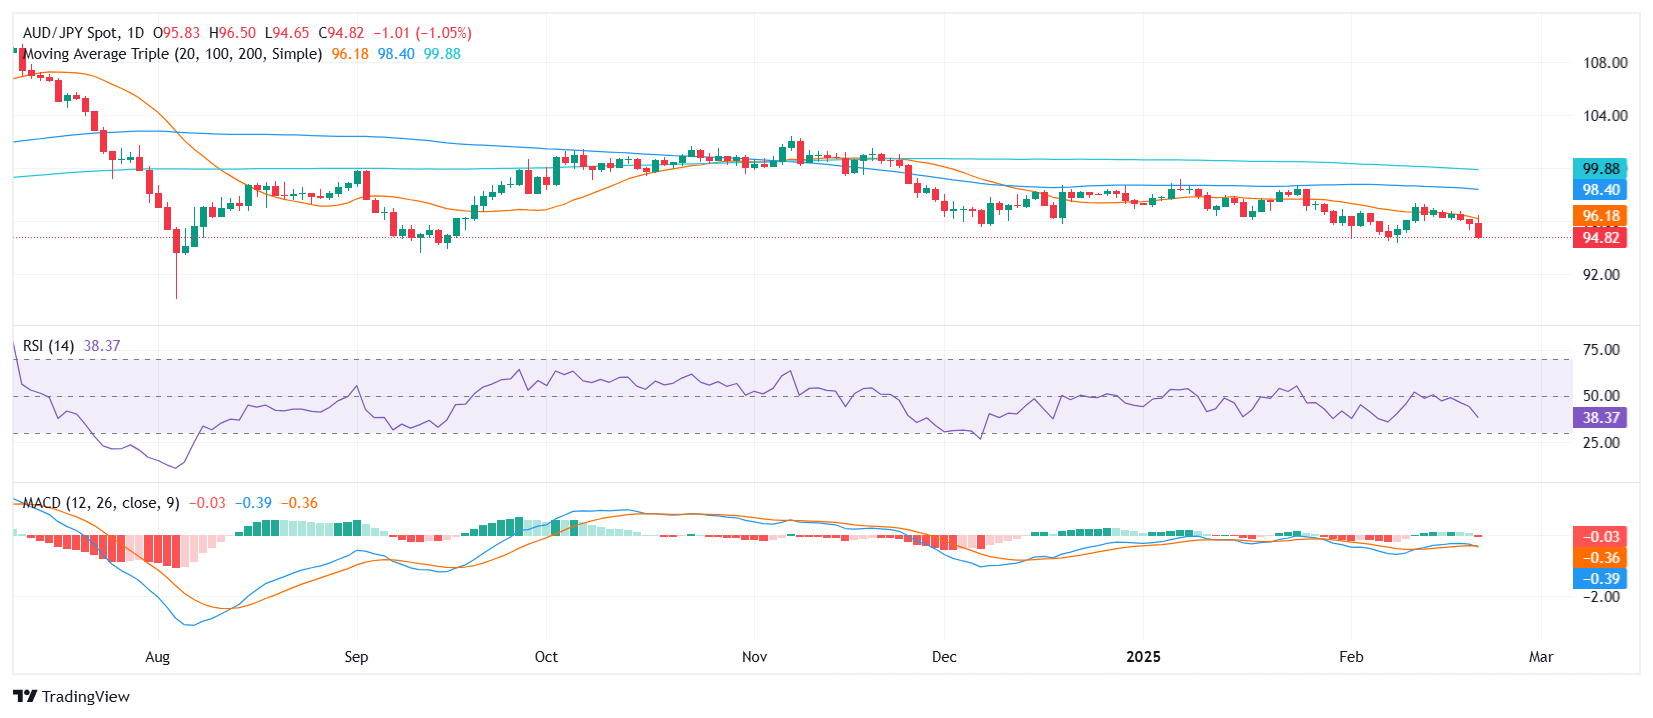
The AUD/JPY cross continued its downward trajectory on Friday to around 94.80, posting sharp losses and breaking through key technical support levels. The pair now trades at its lowest level in over two weeks, signaling that bears have taken firm control. The sustained drop below the 20-day Simple Moving Average (SMA) highlights the shift in market sentiment, with sellers dominating the current trend.

Technical indicators reinforce the negative outlook. The Relative Strength Index (RSI) has plunged deeper into negative territory, suggesting that bearish momentum is accelerating and that the pair could remain under pressure in the near term. Meanwhile, the Moving Average Convergence Divergence (MACD) histogram is showing rising red bars, signaling growing downside momentum as sellers continue to gain ground.

Looking ahead, unless the pair stages a strong recovery back above the 20-day SMA, the bearish outlook is likely to persist. The next support zone could emerge around the 94.50 area, while any attempt at recovery would likely face resistance near the 20-day SMA near 96.00. A decisive break above this level would be needed to shift sentiment and provide buyers with a foothold, though for now, the bears remain in command.

AUD/JPY daily chart

Author

Patricio Martín

Patricio is an economist from Argentina passionate about global finance and understanding the daily movements of the markets.

More from Patricio Martín
Share:

Markets move fast. We move first.

Orange Juice Newsletter brings you expert driven insights - not headlines. Every day on your inbox.

By subscribing you agree to our Terms and conditions.

Editor's Picks

EUR/USD clings to small gains near 1.1750

Following a short-lasting correction in the early European session, EUR/USD regains its traction and clings to moderate gains at around 1.1750 on Monday. Nevertheless, the pair's volatility remains low, with investors awaiting this weeks key data releases from the US and the ECB policy announcements.

GBP/USD edges higher toward 1.3400 ahead of US data and BoE

GBP/USD reverses its direction and advances toward 1.3400 following a drop to the 1.3350 area earlier in the day. The US Dollar struggles to gather recovery momentum as markets await Tuesday's Nonfarm Payrolls data, while the Pound Sterling holds steady ahead of the BoE policy announcements later in the week.

Gold stuck around $4,300 as markets turn cautious

Gold loses its bullish momentum and retreats below $4,350 after testing this level earlier on Monday. XAU/USD, however, stays in positive territory as the US Dollar remains on the back foot on growing expectations for a dovish Fed policy outlook next year.

Solana consolidates as spot ETF inflows near $1 billion signal institutional dip-buying

Solana price hovers above $131 at the time of writing on Monday, nearing the upper boundary of a falling wedge pattern, awaiting a decisive breakout. On the institutional side, demand for spot Solana Exchange-Traded Funds remained firm, pushing total assets under management to nearly $1 billion since launch. 

Big week ends with big doubts

The S&P 500 continued to push higher yesterday as the US 2-year yield wavered around the 3.50% mark following a Federal Reserve (Fed) rate cut earlier this week that was ultimately perceived as not that hawkish after all. The cut is especially boosting the non-tech pockets of the market.

Solana Price Forecast: SOL consolidates as spot ETF inflows near $1 billion signal institutional dip-buying

Solana (SOL) price hovers above $131 at the time of writing on Monday, nearing the upper boundary of a falling wedge pattern, awaiting a decisive breakout.