|

Apple stock (AAPL) Elliott Wave: Forecasting the next move

In this technical article we’re going to look at the Elliott Wave charts of  Apple Stock (AAPL)  published in members area of the website. As our members know, we have been calling for a pullback in the stock. As expected, the correction unfolded in a clear three-wave structure before buyers stepped back in. In this discussion, we will break down the Elliott Wave forecast.

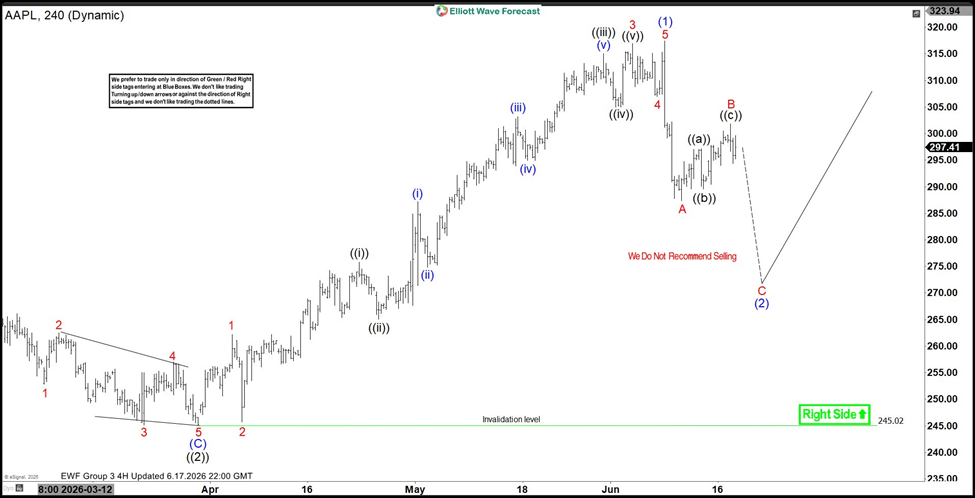
AAPL Elliott Wave four-hour chart 06.17.2026

The current view suggests that AAPL stock has started a new bullish cycle. The stock completed the cycle from the 245 low as an impulsive five-wave structure, which is a bullish confirmation.

As markets rarely move in a single direction, a three-wave correction typically follows a five-wave advance, providing an opportunity to join the trend. At this stage, we can see a sharp decline from the peak, which appears to be unfolding in a five-wave structure, suggesting that another leg lower is still needed.

So far, we have seen only the first leg of the Wave (2) correction, marked as A (red). A three-wave bounce in B (red) has also developed. While price remains below the current short-term high, Wave C (red) should ideally be in play, targeting the 272.4–265.3 area (buying zone).

As Elliott Wave practitioners and our members know, these reversal zones are typically identified by measuring the equal legs area (1.00–1.236 Fibonacci extension of A relative to B), using the Fibonacci extension tool.
Chart

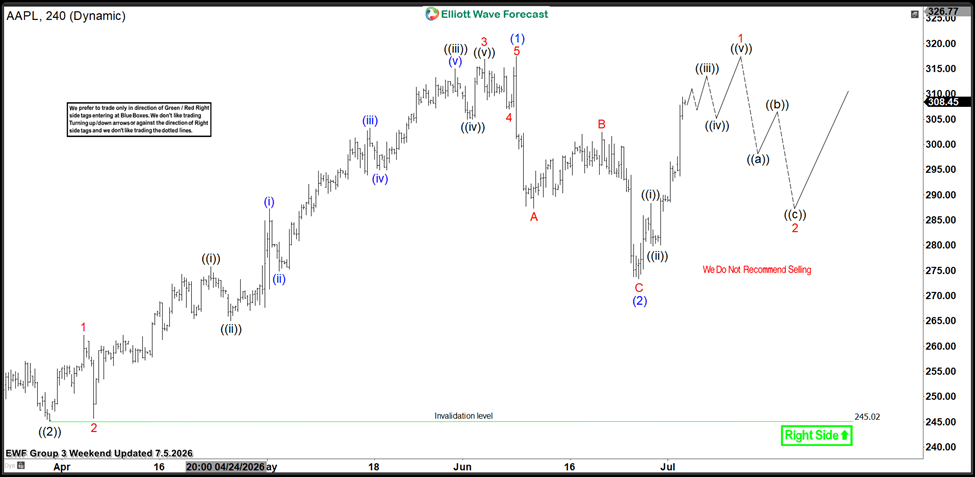
AAPL Elliott Wave four-hour chart 06.17.2026

The stock has made another leg down in Wave C (red) and completed the correction. Unfortunately, it missed our buying zone by a few points and completed the correction slightly above our entry level. This time, the market left us without the trade.It is important to mention that when we miss the optimal entry, we avoid entering in the middle of the move. Instead, we wait for a new setup to develop. At this stage, we would like to see a break above the Wave (1) blue peak to confirm a further bullish extension. Once this breakout occurs, we will look for another three-wave pullback before considering new buying opportunities.
Chart

Author

Elliott Wave Forecast Team

Elliott Wave Forecast Team

ElliottWave-Forecast.com

More from Elliott Wave Forecast Team
Share:

Editor's Picks

GBP/USD clings to gains near 1.3650 after mixed UK data

GBP/USD trades in positive territory at around 1.3650 in the European session on Friday as the upbeat PMI data supports Pound Sterling despite disappointing Retail Sales figures. Meanwhile, the US Dollar (USD) struggles to stay resilient against its peers following the Treasury Department's decision to boost long-term bond purchases earlier in the week, helping the pair hold its ground ahead of US PMI data.

EUR/USD holds near 1.1700 ahead of US PMI data

EUR/USD consolidates its weekly gains at around 1.1700 in the European session on Friday following the mixed PMI prints from Germany and the Eurozone. Investors await preliminary August PMI surveys for the US, while the persistent USD weakness allows the pair to keep its footing.

Gold hits fresh high since June above $4,550 as receding Fed hike bets undermine USD

Gold sticks to modest gains near its highest level since early June, touched earlier this Friday, and trades just above $4,550 heading into the European session. The commodity is looking to build on the breakout momentum above a technically significant 200-day Simple Moving Average amid a weaker US Dollar. Traders scaled back their bets on an immediate interest rate hike by the Fed after the latest US inflation data released last week signaled signs of cooling price pressures.

Bulls in control with Bitcoin heading toward $80,000, Ethereum $2,500, XRP $1.50
Bitcoin (BTC), Ethereum (ETH) and Ripple (XRP) are extending their rallies as bullish momentum strengthens and continue to cheer the US Treasury’s decision to double its debt buyback operations. BTC has climbed nearly 20%, ETH over 25% and XRP nearly 30% so far this week.
The Japanese Yen’s historic rescue is running out of steam
The Japanese Yen staged a spectacular 900-pip comeback after a historic US-Japan intervention. Less than three weeks later, that rescue is already showing signs of fading. The Yen is benefiting somewhat from a softer US Dollar, but its downward trend is likely to resume as the underlying pressure on the currency has not disappeared.
$20 billion offered, $2 billion taken: Why Treasury doubled its buyback cap

The US Treasury moved off its own calendar on Wednesday, and that is the part worth sitting with. At 12:32 GMT, the department said it would at least double the size of liquidity support buyback operations in the 10-year to 20-year and 20-year to 30-year sectors, lifting the maximum from $2 billion per operation to at least $4 billion, effective September 9 and running to November 4.