Apple (AAPL) Elliott Wave: Perfect reaction from the blue box

In this technical article, we are going to present Elliott Wave charts trading setup of Apple Stock (AAPL ). The stock completed its corrective decline precisely at the Equal Legs area, also known as the Blue Box. In the following sections, we’ll break down the Elliott Wave structure in detail and explain the setup and present the target levels.
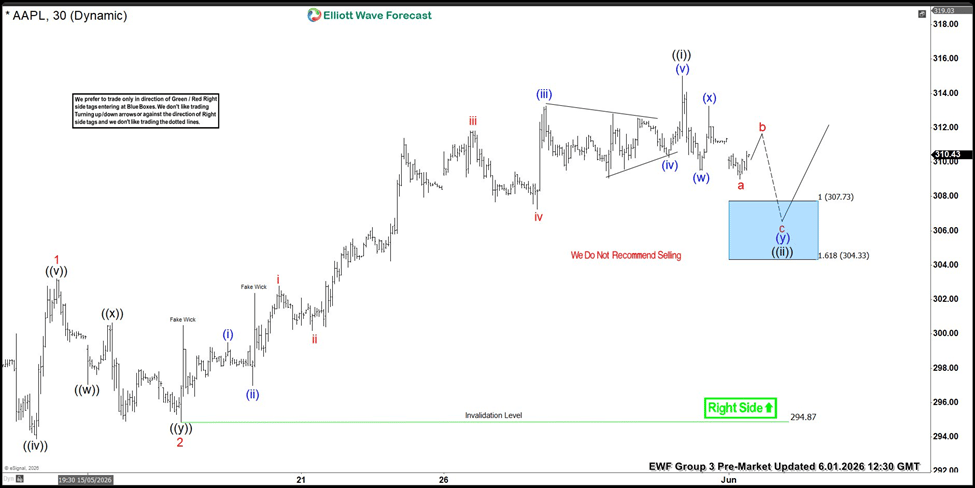
AAPL Elliott Wave one-hour chart 06.01.2026
The current analysis suggests that Apple stock is forming a wave ((ii)) black pull back. Blue Box, buying zone comes at 307.73-304.33. We recommend members avoid selling Apple stock, as the main trend remains bullish. We anticipate at least a 3-wave bounce from this Blue Box area. Once the price touches the 50% fib level against the (x) blue connector, we’ll make positions risk-free, set the stop-loss at breakeven, and book partial profits. Stop Loss is placed a few points below 1.618 fib extension : 304.33
Charts with Black stamps are not tradable.
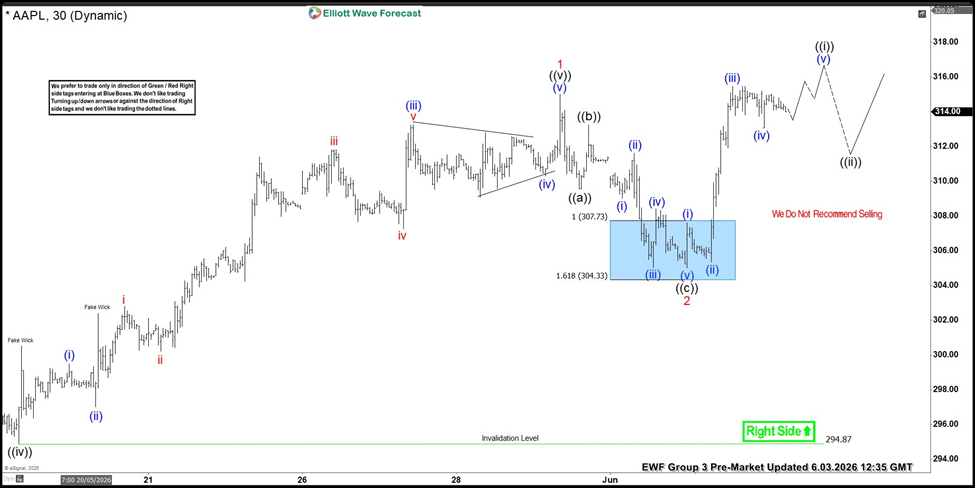
AAPL Elliott Wave one-hour chart 06.01.2026
The stock found buyers into the Blue Box area, just as expected. AAPL completed correction above the invalidation level and made a decent reaction higher from our buying zone. As a result all long positions are risk free + partial profits have been taken. As long as price holds the pivot at 294.87 , further upside remains likely
Author

Elliott Wave Forecast Team
ElliottWave-Forecast.com


