Analysts agree: Oil prices likely to fall further even after returning to pre-war levels
- Oil prices trade flat, but are likely to remain under pressure amid hopes of energy oversupply.
- The OPEC+ has agreed to raise Oil output targets by 188K barrels a day.
- Analysts at Citi expect Brent Crude Oil to slide further to $60 by year-end.

Brent Crude Oil trade flat near $71.90 during the European trading session on Monday. The Oil price is broadly under pressure as traffic near the Strait of Hormuz, a critical chokepoint for almost 20% of global energy supply, has increased amid the ongoing ceasefire between the United States (US) and Iran.
Oil prices rallied significantly when the Middle East war started in late February, disrupting global oil supply. Still, prices have fallen significantly due to the resumption of shipping through Hormuz and the ceasefire framework reached between Lebanon, Israel, and the US.
Meanwhile, the OPEC+ has also announced an increase in Oil supply, a scenario that will increase the overall availability of Oil in the global market. Over the weekend, the OPEC and its allies (OPEC+), including Russia, agreed to raise their output targets by 188,000 barrels a day starting in August.
Market experts have stated that signs of increasing overall crude oil supply could push oil prices below pre-Middle East war levels.
Analysts at Citi have said in a note that Brent Crude Oil could slide further to $60 by the year-end, with fundamentals rapidly reasserting themselves as Hormuz disruptions fade and shipping flows are normalizing. In the European trade, the Brent Crude Oil trades 0.5% lower at around $71.80, close to the five-month low of $70.26 posted on Thursday.
Also, Goldman Sachs has stated that the oil market has likely entered a different paradigm. “While energy prices are likely to gyrate along the way, oil may gradually decline. The market is likely to grind lower, even as some news headlines could cause prices to jump temporarily,” said analysts.
Brent Oil technical analysis
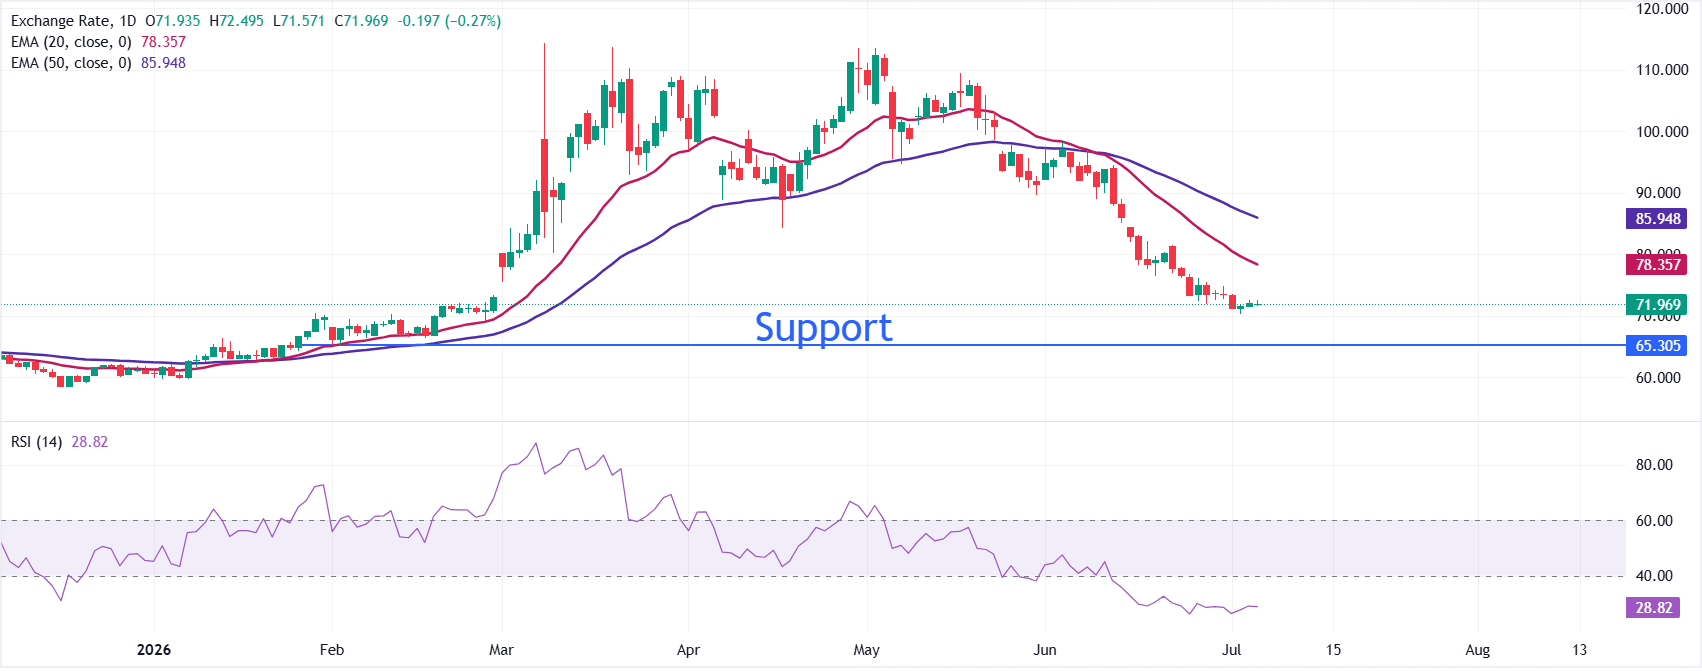
Bias: Brent Oil trades at $71.96, maintaining a negative near-term bias as it holds well below the bearish crossover of the 20-day and 50-day exponential moving averages (EMAs). The 20-day EMA at roughly $78.36 and the 50-day EMA near $85.95 both sit overhead, suggesting rallies remain corrective while price is capped beneath these dynamic resistance lines.
Momentum: The Relative Strength Index (14) hovers around 29, in oversold territory, hinting that while downside pressure persists, the risk of short-term stabilization or a technical bounce is growing.
Resistance: On the topside, initial resistance is seen at the 20-day EMA around $78.36, followed by the June 22 high at $81.55.
Support: Looking down, the oil price could slide to the February 2 low at $65.32 if it resumes its decline below the July 2 low at $70.26. A downside move below $65.32 would expose the oil price to $60.00
(The technical analysis of this story was written with the help of an AI tool.)
Brent Crude Oil FAQs
Brent Crude Oil is a type of Crude Oil found in the North Sea that is used as a benchmark for international Oil prices. It is considered ‘light’ and ‘sweet’ because of its high gravity and low sulfur content, making it easier to refine into gasoline and other high-value products. Brent Crude Oil serves as a reference price for approximately two-thirds of the world's internationally traded Oil supplies. Its popularity rests on its availability and stability: the North Sea region has well-established infrastructure for Oil production and transportation, ensuring a reliable and consistent supply.
Like all assets supply and demand are the key drivers of Brent Crude Oil price. As such, global growth can be a driver of increased demand and vice versa for weak global growth. Political instability, wars, and sanctions can disrupt supply and impact prices. The decisions of OPEC, a group of major Oil-producing countries, is another key driver of price. The value of the US Dollar influences the price of Brent Crude Oil, since Oil is predominantly traded in US Dollars, thus a weaker US Dollar can make Oil more affordable and vice versa.
The weekly Oil inventory reports published by the American Petroleum Institute (API) and the Energy Information Agency (EIA) impact the price of Brent Crude Oil. Changes in inventories reflect fluctuating supply and demand. If the data shows a drop in inventories it can indicate increased demand, pushing up Oil price. Higher inventories can reflect increased supply, pushing down prices. API’s report is published every Tuesday and EIA’s the day after. Their results are usually similar, falling within 1% of each other 75% of the time. The EIA data is considered more reliable, since it is a government agency.
OPEC (Organization of the Petroleum Exporting Countries) is a group of 12 Oil producing nations who collectively decide production quotas for member countries at twice-yearly meetings. Their decisions often impact Brent Crude Oil prices. When OPEC decides to lower quotas, it can tighten supply, pushing up Oil prices. When OPEC increases production, it has the opposite effect. OPEC+ refers to an expanded group that includes ten extra non-OPEC members, the most notable of which is Russia.
Author

Sagar Dua
FXStreet
Sagar Dua is associated with the financial markets from his college days. Along with pursuing post-graduation in Commerce in 2014, he started his markets training with chart analysis.