|

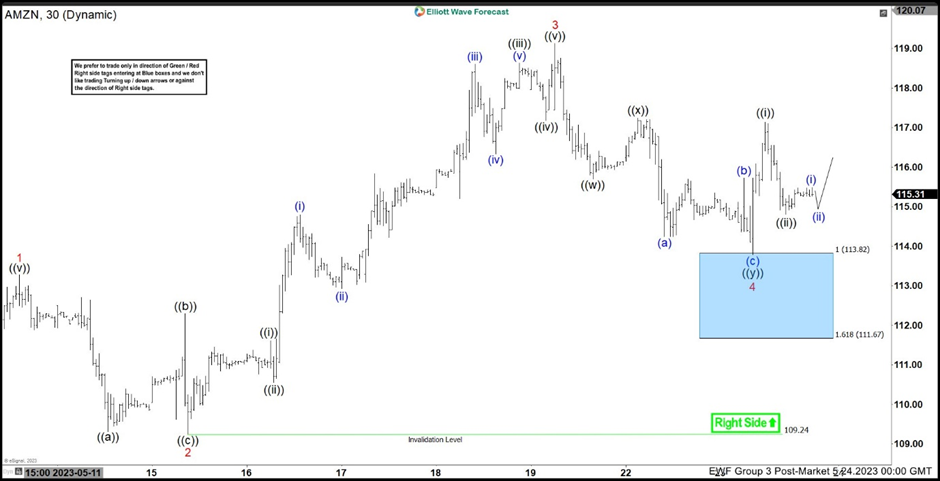
AMZN starting to react from the blue box area

In this technical blog, we will look at the past performance of the 1-hour Elliott Wave Charts of Amazon ticker symbol: AMZN. In which, the rally from 01 May 2023 low unfolded as an impulse structure. And showed a higher high sequence favored more upside extension to take place. Therefore, we advised members not to sell the stock & buy the dips in 3, 7, or 11 swings at the blue box areas. We will explain the structure & forecast below:

AMZN 1-hour Elliott Wave chart from 5.23.2023

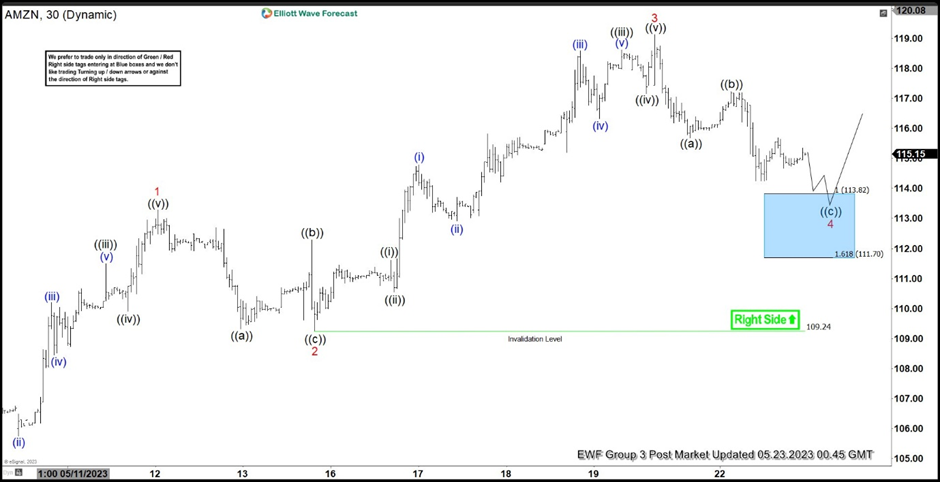
Here’s the 1hr Elliott wave chart from the 5/23/2023 Post-Market update. In which, the rally from the 5/01/2023 low unfolded in an impulse sequence where wave 1 ended at $113.28 high. Then wave 2 pullback ended at $109.24 & made a rally higher in wave 3 towards $118.75 high. Down from there, the stock made a pullback in wave 4 while the internals of that pullback unfolded as Elliott wave zigzag structure where wave ((a)) ended at $115.70 low. Wave ((b)) ended at $117.24 high and wave ((c)) managed to reach the blue box area at $113.82- $111.70 area. From there, buyers were expected to appear looking for the next leg higher or for a 3 wave bounce minimum.

AMZN latest 1-hour Elliott Wave chart

Author

Elliott Wave Forecast Team

Elliott Wave Forecast Team

ElliottWave-Forecast.com

More from Elliott Wave Forecast Team
Share:

Markets move fast. We move first.

Orange Juice Newsletter brings you expert driven insights - not headlines. Every day on your inbox.

By subscribing you agree to our Terms and conditions.

Editor's Picks

EUR/USD rebounds after falling toward 1.1700

EUR/USD gains traction and trades above 1.1730 in the American session, looking to end the week virtually unchanged. The bullish opening in Wall Street makes it difficult for the US Dollar to preserve its recovery momentum and helps the pair rebound heading into the weekend.

GBP/USD steadies below 1.3400 as traders assess BoE policy outlook

Following Thursday's volatile session, GBP/USD moves sideways below 1.3400 on Friday. Investors reassess the Bank of England's policy oıtlook after the MPC decided to cut the interest rate by 25 bps by a slim margin. Meanwhile, the improving risk mood helps the pair hold its ground.

Gold stays below $4,350, looks to post small weekly gains

Gold struggles to gather recovery momentum and stays below $4,350 in the second half of the day on Friday, as the benchmark 10-year US Treasury bond yield edges higher. Nevertheless, the precious metal remains on track to end the week with modest gains as markets gear up for the holiday season.

Crypto Today: Bitcoin, Ethereum, XRP rebound amid bearish market conditions

Bitcoin (BTC) is edging higher, trading above $88,000 at the time of writing on Monday. Altcoins, including Ethereum (ETH) and Ripple (XRP), are following in BTC’s footsteps, experiencing relief rebounds following a volatile week.

How much can one month of soft inflation change the Fed’s mind?

One month of softer inflation data is rarely enough to shift Federal Reserve policy on its own, but in a market highly sensitive to every data point, even a single reading can reshape expectations. November’s inflation report offered a welcome sign of cooling price pressures. 

XRP rebounds amid ETF inflows and declining retail demand demand

XRP rebounds as bulls target a short-term breakout above $2.00 on Friday. XRP ETFs record the highest inflow since December 8, signaling growing institutional appetite.