$AMD shows the path into $900, supporting world indices

Advanced Micro Devices (AMD) evolution and market position
Advanced Micro Devices, Inc. ($AMD) has grown from a secondary semiconductor maker into one of the world’s most influential technology firms. Founded in 1969 by Jerry Sanders and former Fairchild Semiconductor executives, AMD first produced logic chips and processors during the personal computing revolution. Over five decades, it transformed into a leader in high‑performance computing, AI acceleration, gaming hardware, and data center infrastructure.
For years, AMD competed directly with Intel in CPUs and NVIDIA in GPUs. The company faced financial stress and market share losses in the 2000s and early 2010s. Its turnaround began in the late 2010s with the launch of Ryzen CPUs in 2017 and EPYC server processors. These products reshaped the semiconductor landscape, restoring AMD’s leadership in several performance categories and boosting market share across desktop, laptop, gaming, and enterprise markets.
Under CEO Dr. Lisa Su, AMD became one of the strongest growth stories in technology. Revenue and profitability surged as cloud providers, enterprises, and consumers adopted AMD solutions. The acquisition of Xilinx expanded its reach into adaptive computing, embedded systems, and AI infrastructure.
AMD products now power gaming consoles such as Sony’s PlayStation and Microsoft’s Xbox, high‑performance data centers, AI workloads, and cloud systems. Rising AI demand and next‑generation computing needs have positioned AMD as a major player in the global semiconductor cycle.
From a market perspective, AMD is closely tied to the broader technology sector and global equity indices. Investor sentiment around AMD often reflects expectations for AI growth, enterprise spending, and cloud expansion. The stock has become a key component in indices such as the Nasdaq and the S&P 500.
Elliott Wave analysis
The company’s long-term chart structure reflects not only fundamental growth but also strong cyclical and impulsive market behavior consistent with large technological innovation waves. This combination of historical transformation, expanding institutional relevance, and powerful market momentum makes AMD one of the most technically and fundamentally important symbols to analyze through the lens of Elliott Wave Theory.
From the all-time lows, $AMD shows a clear five-wave advance that ended in March 2024. After that peak, the symbol developed a corrective structure in three waves, which appears to have ended on 04.07.2025. Since then, AMD has started an impressive rally that has become very interesting from an Elliott Wave perspective.
The current rally is impulsive in nature and should continue extending higher. The first target area comes in the $500–$600 zone to complete wave (III). After that, the larger all-time cycle can still extend even higher into the $850–$900 area.
AMD monthly Elliott Wave chart
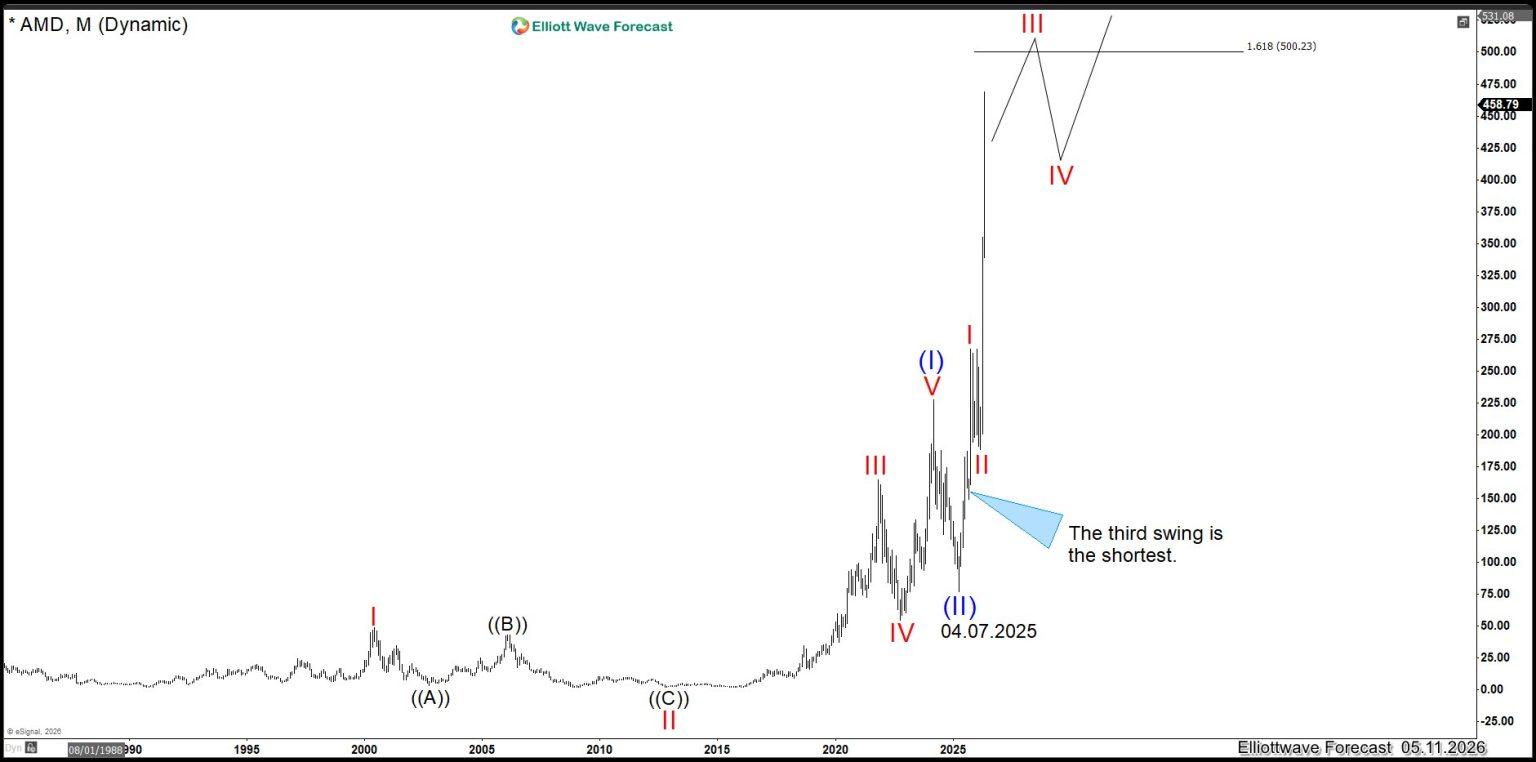
The idea and the nest taking place within the powerful wave (III). A nest is a series of wave (I)(II), followed by another smaller degree I-II structure. Most of the time, this type of formation happens inside a strong wave (III), where acceleration begins to take place.
Elliott Wave Theory has three basic rules:
- Wave (II) cannot trade below the beginning of wave (I).
- Wave (III) cannot be the shortest wave.
- Wave (IV) cannot overlap or penetrate the peak of wave (I).
Everything about the theory can be found on this page:
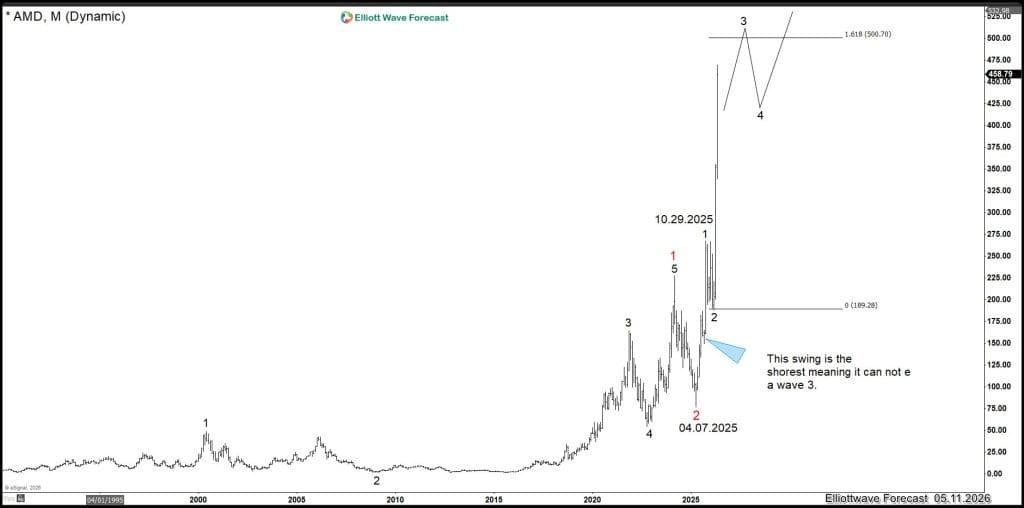
Looking at the price action in detail since the all-time lows in AMD, it is clear that the third swing from 04.07.2025 into the peak at 10.27.2025 was the shortest. This means the five-swing structure remains incomplete, supporting the idea of a nest and the higher target areas mentioned above.
AMD monthly Elliott Wave chart
AMD also appears to be correcting in a higher-degree relationship with world indices. Consequently, the symbol may be leading the next acceleration phase across the broader market. The following chart compares $AMD with $NQ_F, which provides a major clue in today’s market and helps traders remain on the right side of the trend.
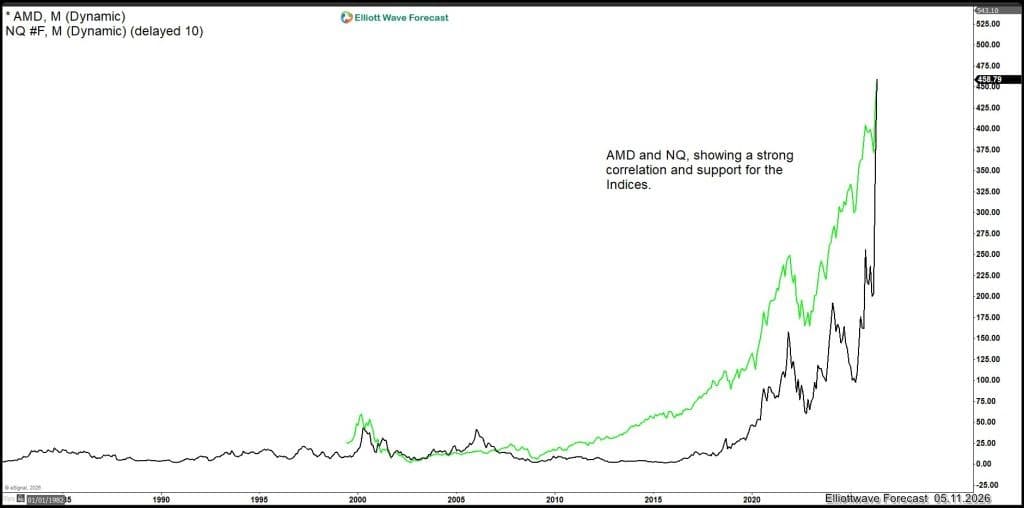
In conclusion, once again, the basic rules of Elliott Wave Theory are allowing us to anticipate future price action. AMD is suggesting that strong support across world indices is coming, and with it, potentially very positive news for the broader market.
Author

Elliott Wave Forecast Team
ElliottWave-Forecast.com
















