|

AMD: Incomplete zigzag pattern forecasted the market path

In this technical blog, we’ll take a closer look at our Elliott Wave charts for Advanced Micro Devices (AMD), published in the members’ area of our website. We identified incomplete bearish sequences within the cycle from the October 6th peak, signaling further downside. In the following analysis, we’ll review the Elliott Wave structure and see how the market followed our outlook.

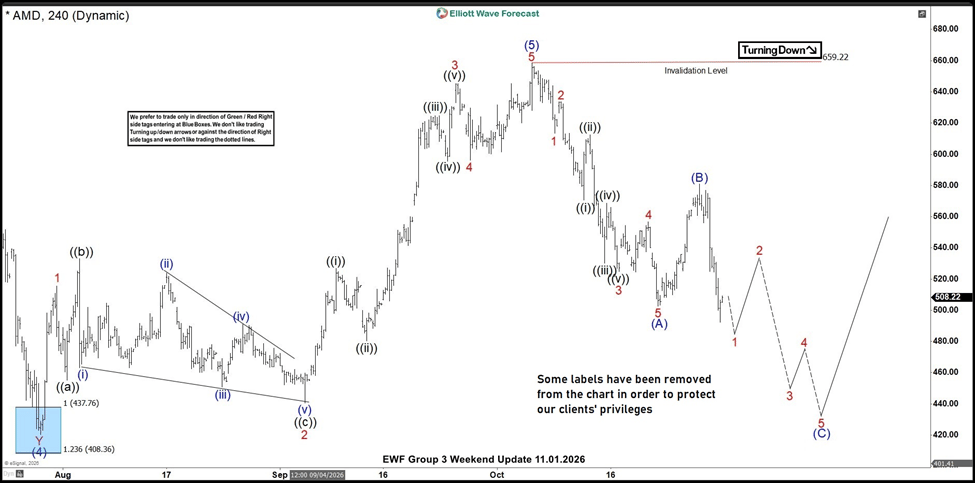
AMD Elliott Wave four-hour chart – November 1, 2026

The break below the October 22nd low, marked as (A) blue, confirmed the incomplete bearish sequences within the cycle from the October 6th peak at 659.22. These types of price structures are very important because incomplete swing sequences can help us anticipate the market’s next move with high accuracy.

The outlook suggested further short-term weakness in the following days. The stock remained bearish against the 581.76 peak, marked as (B) blue on the chart. As long as the price stayed below this level, we expected further downside.

The cycle was forming an Elliott Wave Zigzag pattern. Therefore, we identified the potential downside target by measuring the (A)-(B) Equal Legs area using the Fibonacci Extension tool. In this case, the Equal Legs target zone was at 426.40–389.87. At that zone, we expected buyers to step in and take the lead again, potentially triggering a significant rally toward new highs or, at a minimum, a larger three-wave bounce.
Chart

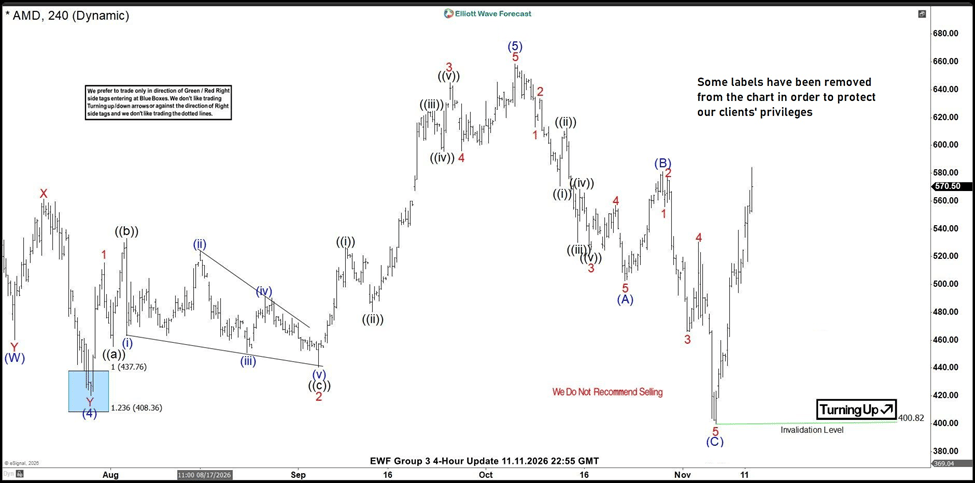
AMD Elliott Wave four-hour chart  11.01.2026

The stock followed the expected path lower. AMD reached the proposed (A)-(B) equal legs target area at 426.40–389.87, found buyers as anticipated, and completed the cycle at the 400.82 low. A sharp rally followed from the buyers’ zone.

This is exactly the type of analysis we teach in our Live Analysis / Trading Sessions, where members learn how to identify incomplete sequences, understand their significance, and use them to anticipate the market’s next move. Keep in mind, not every chart is a trading recommendation. We present high-probability trading opportunities in our Live Trading Room.

Note: Some labels have been removed from the chart to protect our clients’ exclusive analysis. You can find the latest AMD charts in the members’ area of our website.
Chart

Author

Elliott Wave Forecast Team

Elliott Wave Forecast Team

ElliottWave-Forecast.com

More from Elliott Wave Forecast Team
Share:

Editor's Picks

AUD/USD hits eight-month lows below 0.6850 amid bullish USD

AUD/USD stays defensive below 0.6850, hitting an eight-month low in the Asian session on Thursday as the possibility of a steeper Fed rate hike in December helps the US Dollar hold near its highest level since April 2025. Geopolitical uncertainty also supports the safe-haven buck, while the RBA’s cautious, on-hold stance limits the Aussie.

USD/JPY eases from near 160.00 amid looming intervention risks, BoJ hike bets

USD/JPY retreats slightly from an over two-month high as the recent surge back to the 160.00 psychological mark prompted verbal warnings from Japanese authorities and sparked fears of direct FX intervention. Moreover, data showed that Japan’s wholesale inflation picked up again in October, strengthening the case for a BoJ hike in December and lifting the Japanese Yen. However, a bullish US Dollar, bolstered by odds of a jumbo Fed rate hike in December, could cap the pair's downside.


Gold falls below $4,000 as traders weigh a half-point Fed rate hike

Gold (XAU/USD) slips back below $4,000 on Thursday, giving up most of last week’s gains as bets on more aggressive Federal Reserve (Fed) interest rate hikes lift the US Dollar (USD) to a fresh year-to-date high.

Top Altcoins Price Forecast: Ripple, Cardano and Solana halt decline amid signs of exhaustion

Top altcoins, Ripple (XRP), Cardano (ADA), and Solana (SOL), hold steady on Thursday, halting the prevailing decline linked to hot US inflation data and the post-US midterms period.

Why the US Dollar's rally isn't as strong as it looks

The US Dollar Index (DXY) is back at an 18-month high, but most of its climb since August is the Euro falling. Against a wider group of trading partners, the Dollar has gained half as much, and the Federal Reserve has raised rates once this year. The US Dollar Index, which measures the Dollar against six other currencies, is trading near 103.

What the US CPI headline doesn’t tell you about inflation

Brent crude has fallen about a third since mid-October on hopes the Iran war is ending, but diesel, freight and fertiliser costs haven't followed. Those costs reach US consumer prices in stages through 2027 and could keep inflation high after gasoline gets cheaper.