|

AMD approaches wave III completion as potential wave IV pullback could emerge [Video]

AMD remains in a strong bullish sequence, with the rally from the April low unfolding in a clear impulsive structure. However, the five subwaves up from the 187 low suggest that the current cycle may be approaching exhaustion, with a potential finishing wedge pattern forming within wave 5 of III.
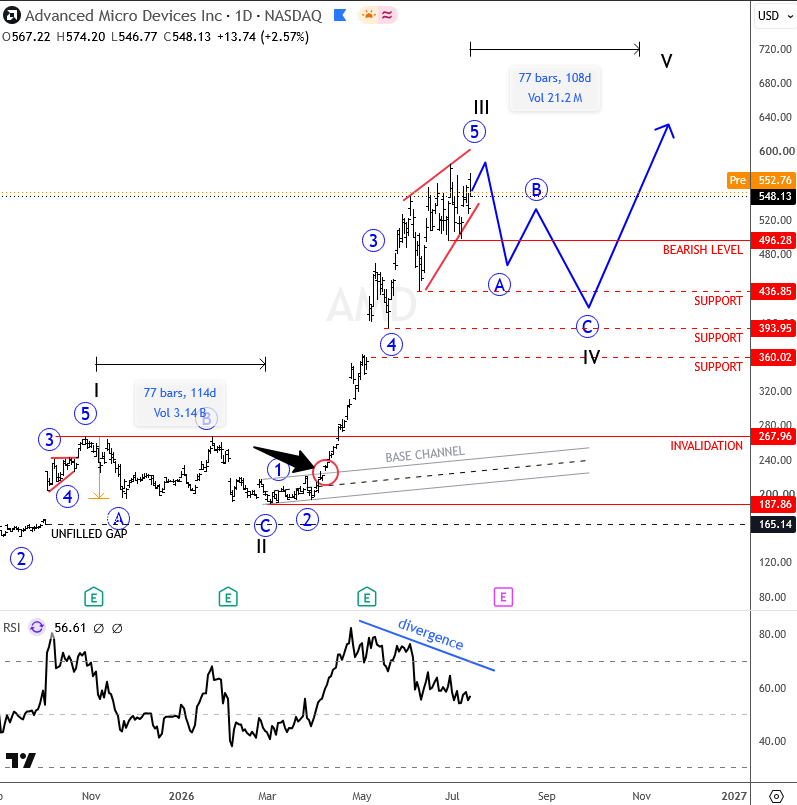
amdD
AMD Daily Chart

If AMD completes this wave III structure, a higher-degree wave IV correction could follow. The key support area to watch is between 360 and 436, where a deeper pullback could provide an attractive opportunity to join the broader uptrend.

The bullish outlook remains valid as long as price holds above the 270 invalidation level. The weekly chart also continues to support a larger wave five advance, but a corrective wave IV pullback may be needed before the next major leg higher.

Highlights

  • Bullish impulsive structure developing from the 187 low, with wave III nearing completion.
  • Potential wave IV support area between 360 and 436.
  • Bullish scenario remains valid above the 270 invalidation level.

For a detailed view and more analysis like this, you can watch our latest recording below, streamed on July 13:

Youtube preview

Get Full Access To Our Premium Elliott Wave Analysis For 14 Days. Click here.

Author

Gregor Horvat

Gregor Horvat

Wavetraders

Experience Grega is based in Slovenia and has been in the Forex market since 2003.

More from Gregor Horvat
Share:

Editor's Picks

AUD/USD recovers toward 0.7000 amid improving mood

AUD/USD is firming up toward 0.7000 in Asia on Tuesday, helped by improving market mood. A pause in the US Dollar rebound also aids the pair's upside. However, geopolitical risks and caution ahead of AI tech earnings report could limit the pair.

USD/JPY flatlines near 158.50 as markets seek direction

USD/JPY steadies around 158.50 in the Asian trading hours on Tuesday. Traders prefer to wait on the sidelines ahead of Japan’s National Consumer Price Index inflation data later on Friday. Meanwhile, elevated US bond yields provide some support to the US Dollar against the Japanese Yen.

Gold alternates gains with losses below $4,200

Gold prices trade without a clear direction on Tuesday, hovering around the $4,170 region per troy ounce and still struggling to regain upside traction following Monday’s pullback. In the meantime, lower US Treasury yields and a marked pullback in the US Dollar come in tandem with the yellow metal’s price action.

Crypto Today: Bitcoin, Ethereum, XRP tick lower amid mixed ETF flows

Bitcoin is trading above $81,000 on Tuesday, aligning with a lethargic tone in the broader cryptocurrency market. Altcoins, including Ethereum and Ripple, reflect Bitcoin’s lock-step price action, trading below $2,400 and $1.30, respectively.

Markets at a turning point: Bitcoin, Gold, FX and Tech react to a heavy macro week

The new trading week opens with a mixed but revealing picture across global markets. Indices, commodities, FX, tech stocks, and cryptocurrencies are all sending one message: risk appetite is alive, but it is cautious, selective, and highly sensitive to macro signals.

The US Dollar fell. Gold didn't rally. That tells you everything
Gold (XAU/USD) is struggling to capitalize on a weaker US Dollar (USD), after repeatedly failing to establish itself above the $4,200 level. The precious metal remains confined to a relatively narrow trading range despite a combination of developments that would normally support higher prices.