|

ALGN blue box support could launch wave V to new highs

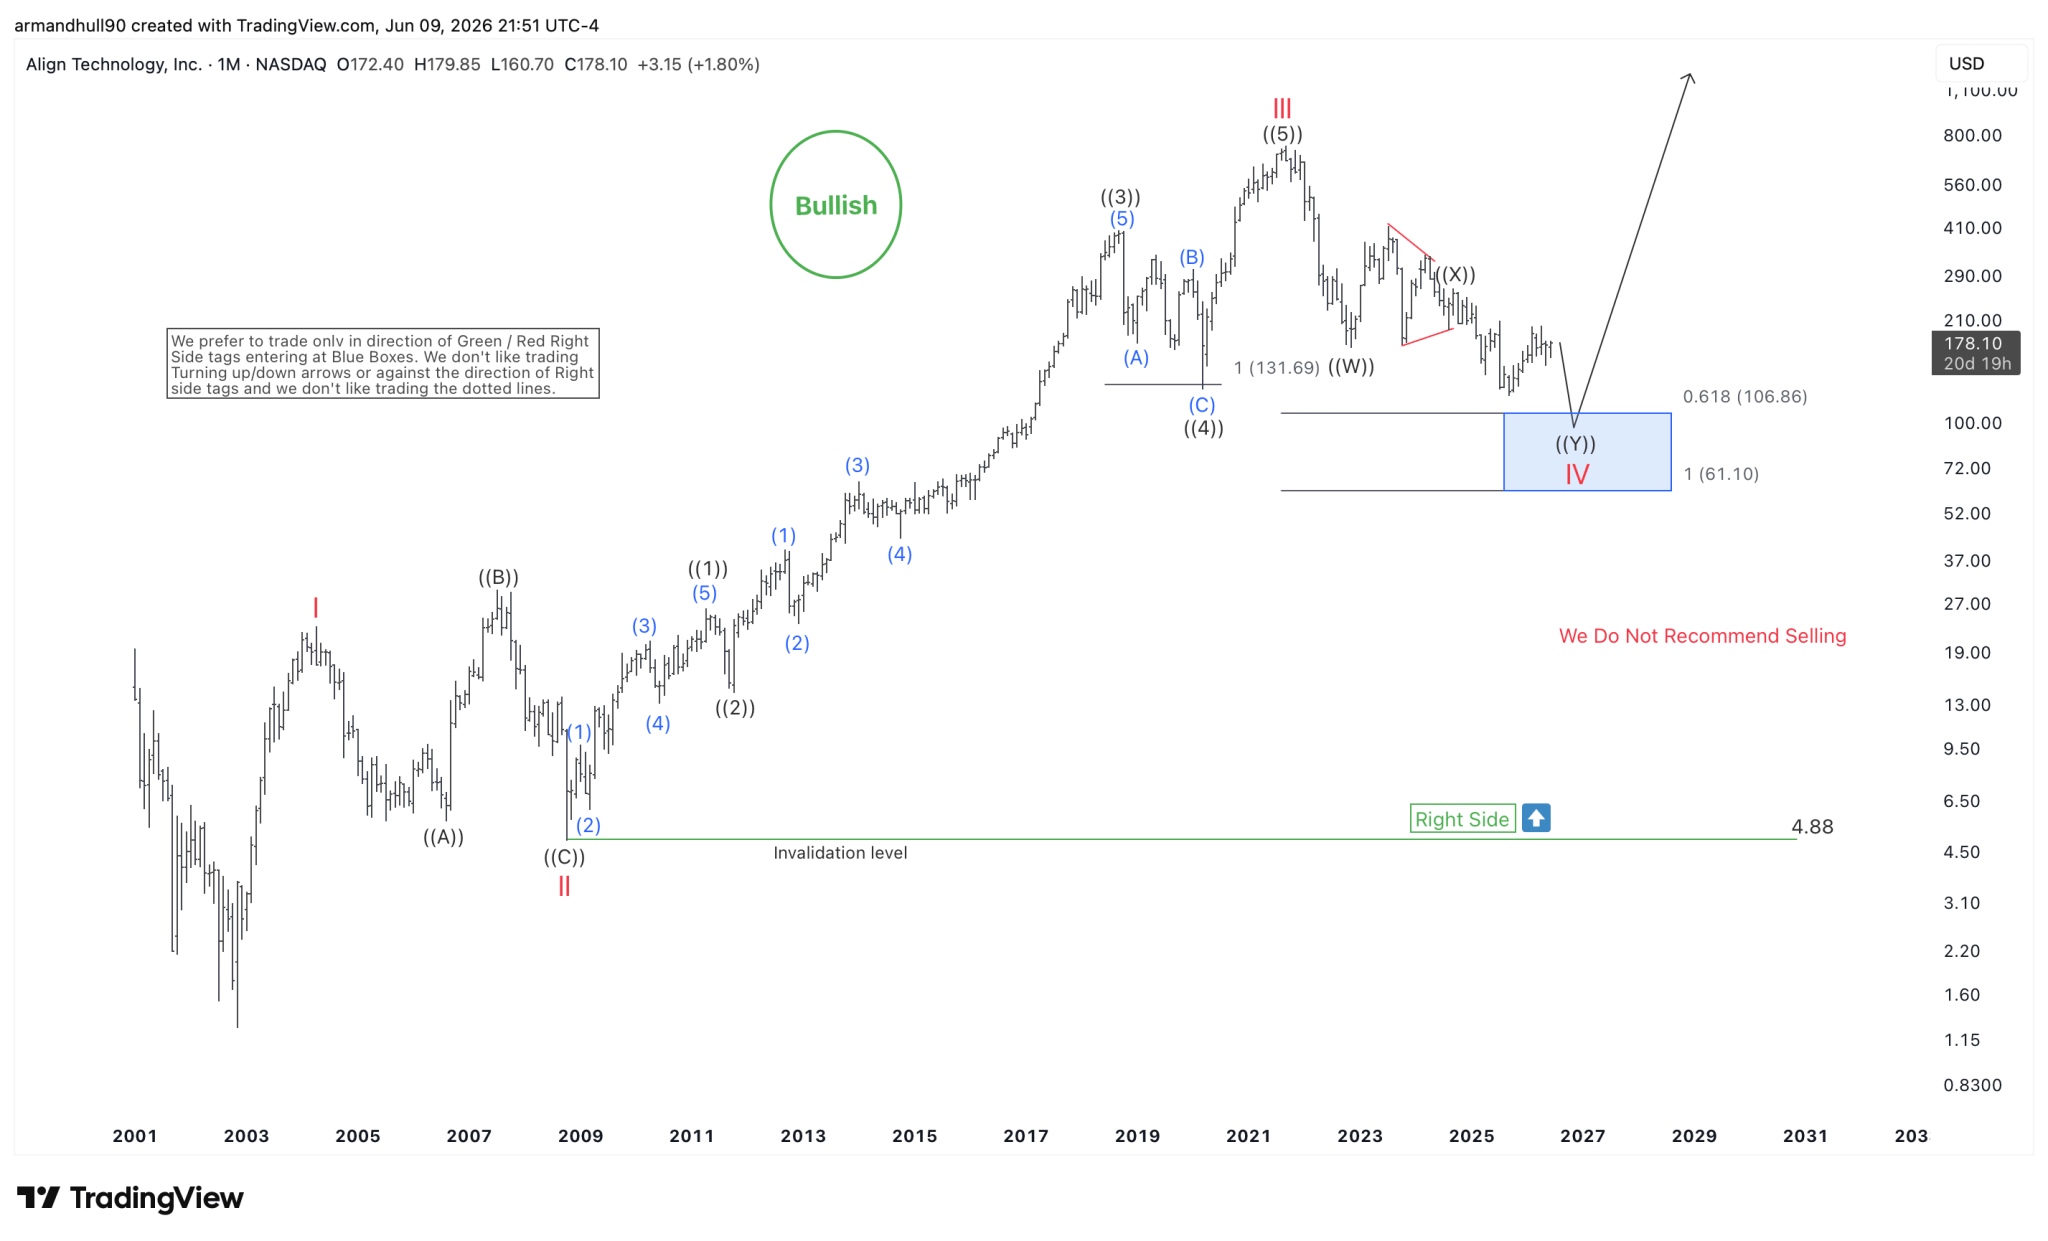
Align Technology (NASDAQ: ALGN) continues to maintain a bullish Elliott Wave structure despite the sharp decline from its 2021 peak. The monthly chart suggests that the stock completed a major wave III advance near the 700 area before entering a large corrective phase. While the correction has lasted several years, the larger bullish cycle remains intact. Following the wave III peak, ALGN began a complex correction that appears to be unfolding as a double three structure. The decline has already completed wave ((W)) and a connecting wave ((X)), while the final leg, wave ((Y)), remains in progress.

The current Elliott Wave count suggests that wave IV is approaching an important support area. The projected blue box between 106.86 and 61.10 represents the 0.618–1.000 Fibonacci extension zone, which is a region where corrective structures often complete and buyers return. This area is considered a high-probability reversal zone. As the stock approaches this support region, we will be looking for signs that the correction is ending and a new bullish cycle is beginning.
Chart

From an Elliott Wave perspective, the ongoing decline appears to be the final phase of the larger wave IV correction. Once wave IV completes, the stock should begin wave V and resume the long-term uptrend. The projected path on the chart suggests a strong rally from the blue box area. We expect wave V to eventually break above the 2021 high and establish new all-time highs. This outlook aligns with the broader bullish structure that has been in place since the 2008 low.

As long as price remains above the long-term invalidation level at 4.88, the larger bullish count remains valid. We do not recommend selling and continue to favor buying pullbacks once the current correction reaches completion.

Conclusion

Align Technology remains in a long-term bullish Elliott Wave cycle despite the ongoing correction. Wave IV appears to be approaching completion within the 106.86–61.10 blue box support area. Once the correction ends, we expect wave V to begin and eventually push the stock to new all-time highs.

Author

Elliott Wave Forecast Team

Elliott Wave Forecast Team

ElliottWave-Forecast.com

More from Elliott Wave Forecast Team
Share:

Editor's Picks

AUD/USD holds firm near 0.7000 after Chinese inflation, trade data

AUD/USD stays firm near 0.7000 in Wednesday’s Asian session, picking up some bids after China's mixed inflation and upbeat trade data. CPI rose less than expected in September, while PPI inflation picked up. Meanwhile, the Chinese trade surplus unexpectedly widened in September. The pair remains underpinned by a broadly subdued US Dollar, despite the Middle East escalation, as focus remains on US CPI data.

USD/JPY consolidates near 158.50; looks to US CPI for fresh impetus

USD/JPY stays range-bound near 158.50 in the Asian session on Wednesday, with looming intervention risks supporting the Japanese Yen and capping upside amid a softer US Dollar. However, geopolitical uncertainties act as a tailwind for the safe-haven USD and the pair. Traders also seem hesitant ahead of the release of the latest US inflation figures.

Gold looks to $4100 and US CPI inflation amid geopolitical risks

Gold falls for the third straight day on Wednesday, as the recent recovery falters ahead of US inflation. US Dollar pauses correction amid rising Oil prices and stabilizing US Treasury bond yields. The daily bearish RSI remains a headwind for Gold buyers, with $4,100 seen at risk.

Strategy bitcoin buying model faces scrutiny as STRC costs climb
Strategy’s (MSTR) STRC financing strategy increased its Bitcoin (BTC) holdings in H1, but made its capital structure more expensive, prompting an examination of its effectiveness, according to a Tuesday report by K33. STRC recovered close to its $100 par value, closing at $99.90 after an extended period of heavy buybacks.
What happens after a US Treasury market crash
The global bond market is under severe pressure as US Treasury yields reach multi-decade highs, driven by persistent inflation risk, heavy government and corporate debt issuance, and expanding term premiums. Higher yields raise borrowing costs and tighten financial conditions, but a severe bond selloff can ultimately shift investor focus from inflation to growth and financial stability.
Has Bitcoin really escaped the macro forces it was built to fight?
Over 17 years ago, Satoshi Nakamoto designed Bitcoin (BTC) on the back of a global financial crisis as an alternative to the global monetary system outside the control of central banks, governments and traditional intermediaries. This raises a key question: has Bitcoin really become independent of the macroeconomic forces it was built to challenge?
















