AI trade splits as Broadcom sells off and MAGS tests support

Broadcom did not report bad earnings, yet it still sold off yesterday after an initial push higher.
Markets were not looking for a normal beat. They wanted Broadcom to smash expectations, especially on future AI revenue guidance. The company delivered strong numbers, but in a market already priced for AI perfection, strong was not enough.
Metric | Reported | Expected | Result |
Revenue | $22.19B | ~$22.13B – $22.27B | Roughly in-line |
Adj EPS | $2.44 | ~$2.39 – $2.40 | Beat |
AI Revenue | $10.8B | $10.7B guide | Beat |
Q3 Revenue Guide | $29.4B | ~$28.3B | Beat |
Q3 AI Revenue Guide | $16.0B | ~$16.36B | Miss vs whisper expectations |
The weak spot was Q3 AI revenue guidance. Broadcom guided for around $16 billion, while some expectations were closer to $16.36 billion.
That is not a huge miss on paper, but when AI stocks have been trading like every report needs to be a blowout, even a small disappointment can matter.
Broadcom’s selloff was less about weak earnings and more about stretched expectations. Investors still appear to like the AI story, but they are becoming harder to impress.
Broadcom is a warning chart, not a broken chart
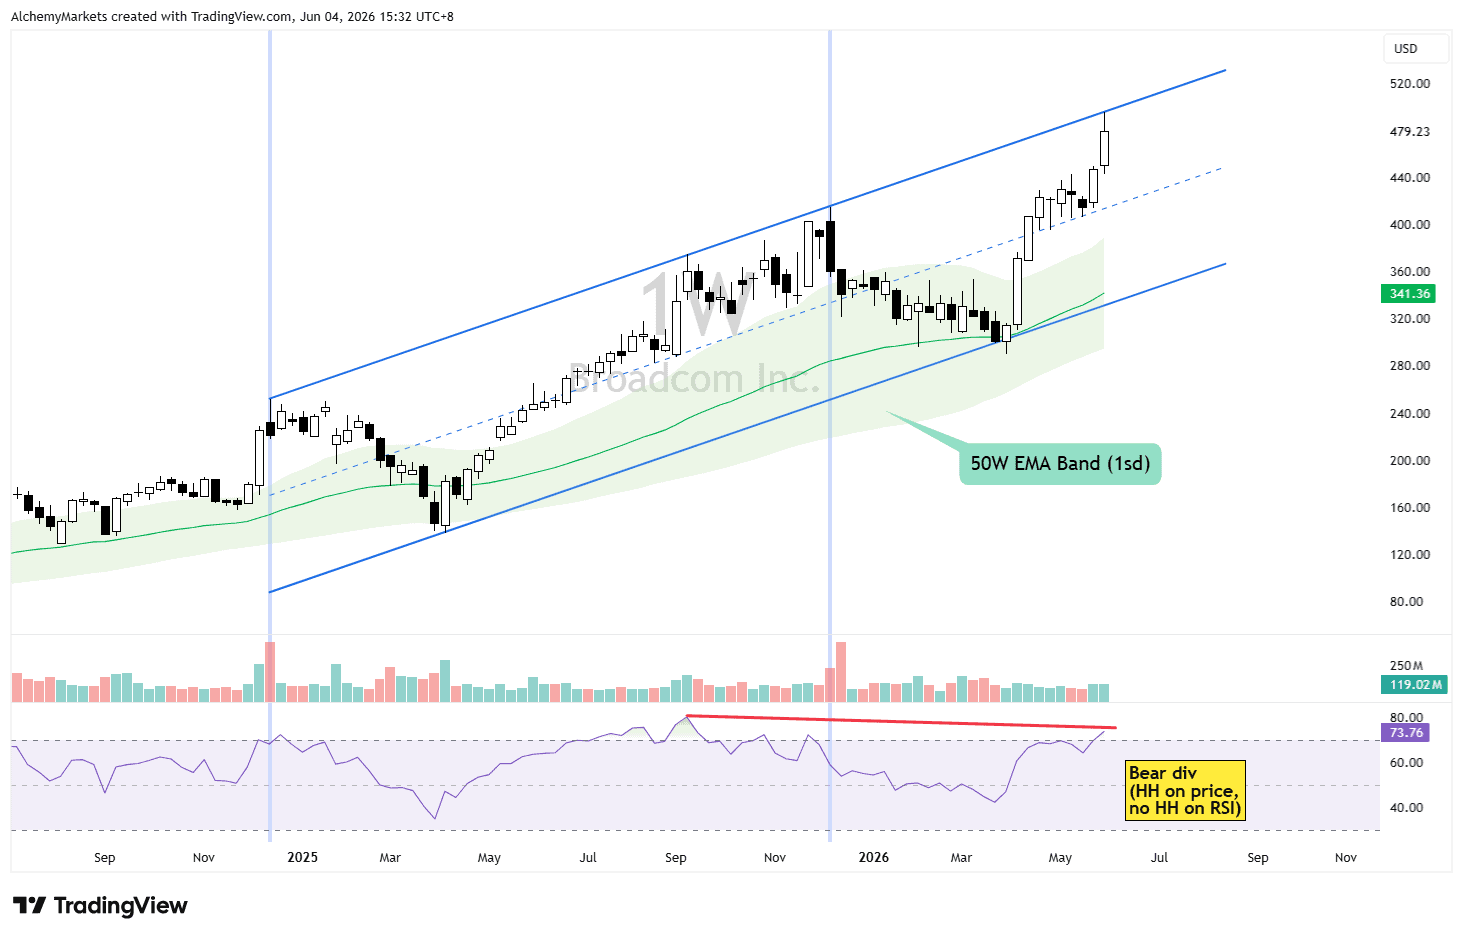
Broadcom is trading near a possible bearish reversal zone, but there is no confirmation yet.
Price is near the top of its rising weekly channel, while RSI is showing bearish divergence. That suggests momentum is not fully confirming the new high.
The chart remains structurally bullish for now. There has been no major bearish volume spike or large weekly rejection candle yet. The 50-week EMA band remains the key long-term support zone.
The AI trade is splitting
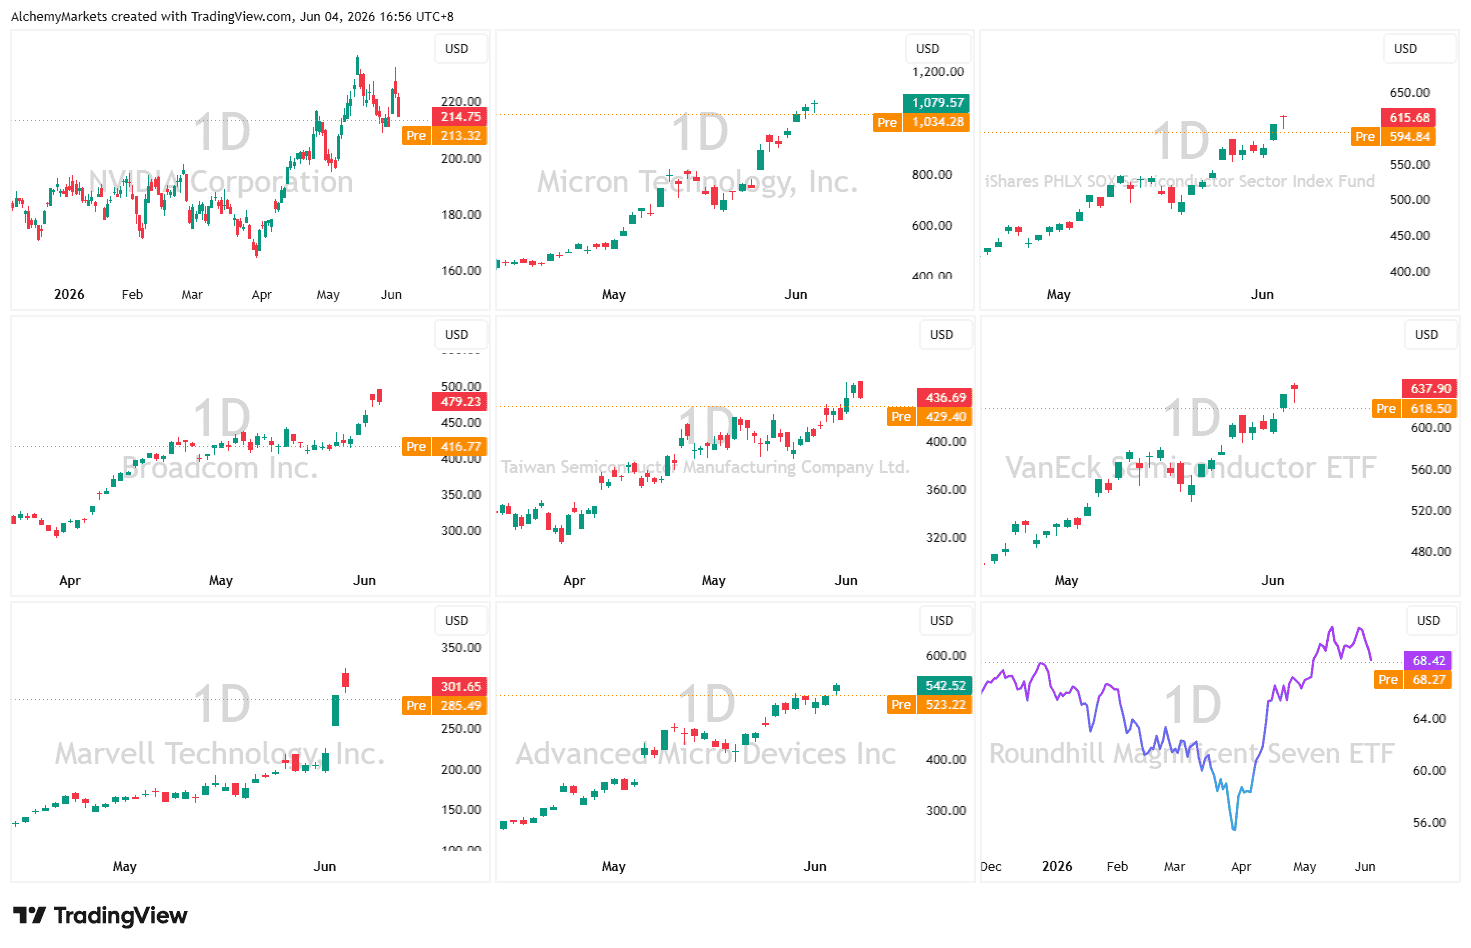
Broadcom sits on the AI seller side, alongside names like Nvidia, TSMC, Micron, Marvell and AMD. These are the companies selling the chips, networking, memory and infrastructure needed for AI buildout.
So far, the broader seller side is not breaking. Micron, TSMC, Marvell, AMD, SMH and SOXX continue to trade near highs, while only Nvidia and Broadcom are showing signs of cooling.
That makes Broadcom’s reaction look more stock-specific than sector-wide, at least for now.
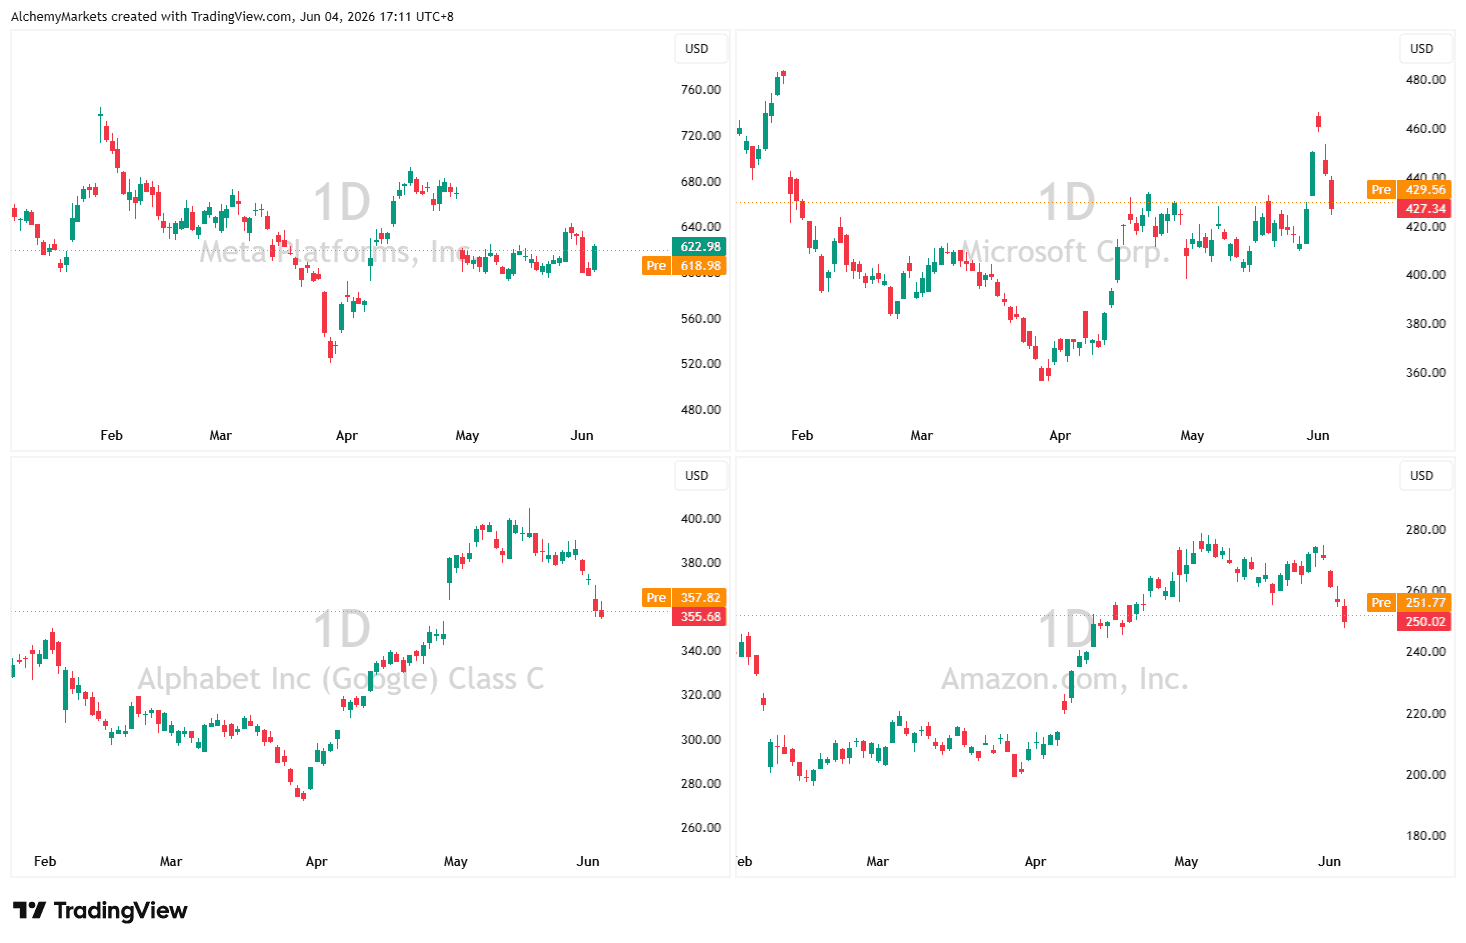
The bigger weakness is showing up on the buyer side.
Meta is largely moving sideways, while Alphabet and Amazon are already rolling over from their May highs. The weakness is not broad enough to call a trend reversal yet, but momentum has clearly slowed among some of the largest AI spenders.
These are the companies spending heavily on AI infrastructure, cloud capacity, models and data centres. Investors are now asking whether that spending can turn into enough revenue to justify the valuation.
The market is not abandoning AI. It is becoming more selective about who actually benefits from it.
MAGS technical analysis
The weakness in Alphabet and Amazon also helps explain why MAGS is testing a key support level. As an ETF heavily weighted toward the largest AI spenders, MAGS may provide a cleaner read on investor sentiment toward AI monetisation than any individual stock.
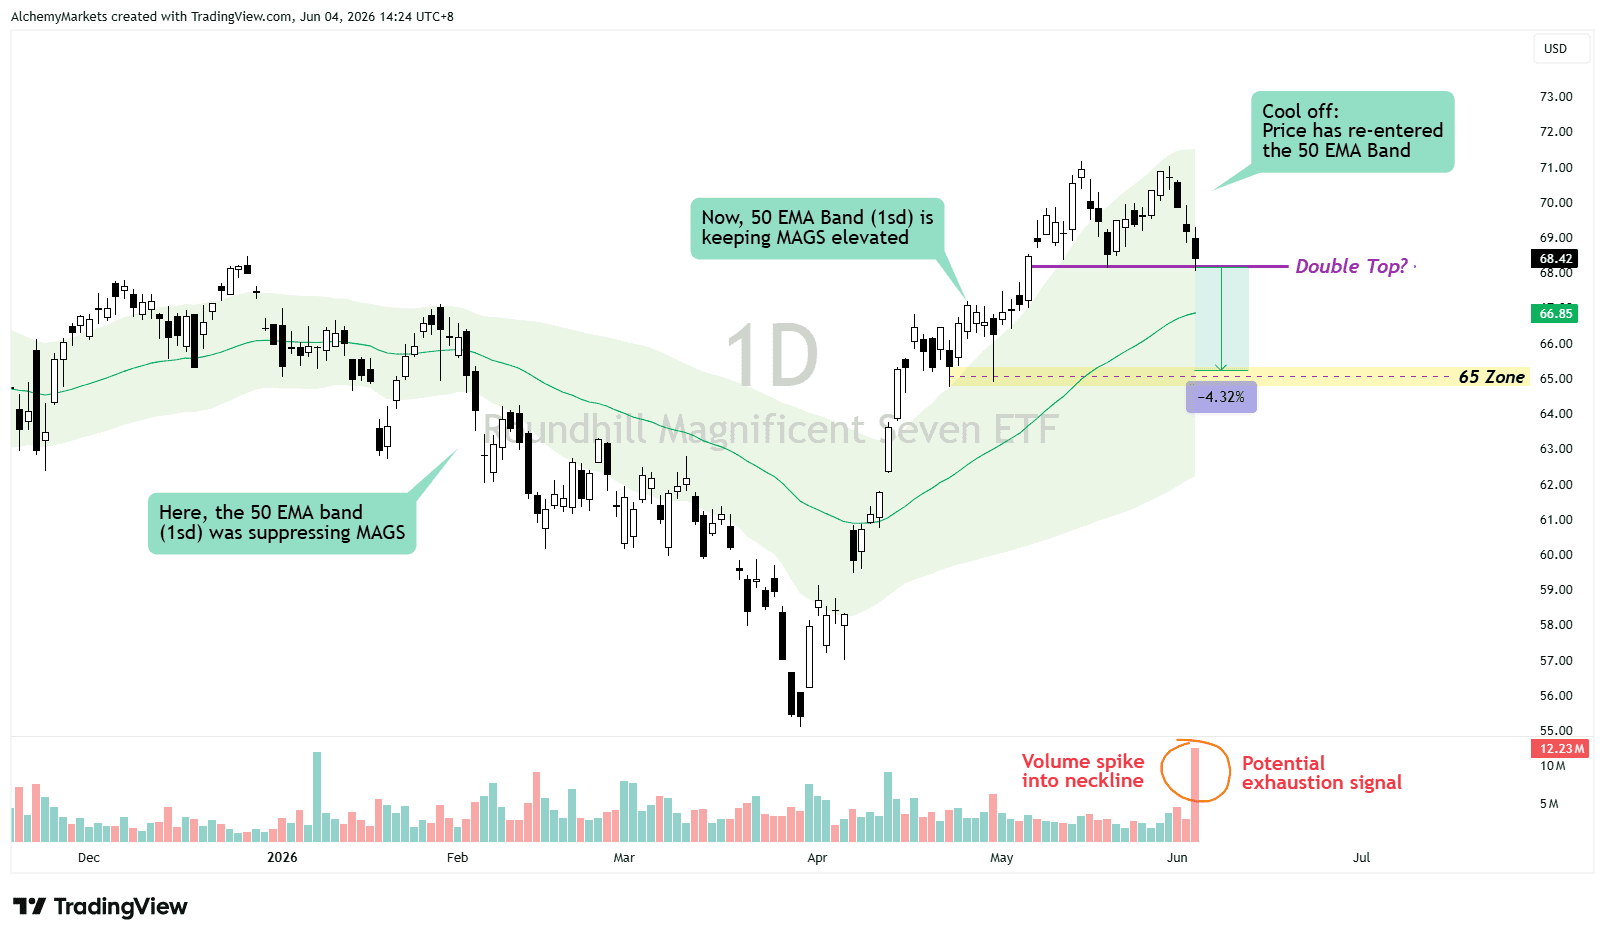
MAGS is testing the neckline of a potential double top near 68.
A decisive break below 68 would confirm the pattern and bring the 65 zone into focus as the next downside target.
For now, the pattern is still unconfirmed. MAGS is still supported by its 50-day EMA band, which has acted as a useful support and resistance cloud in the past.
The recent volume spike into the neckline also raises the risk of a fakeout.
A fakeout would not automatically mean new highs are next. It could instead turn into a slower rounding top or inverse cup-and-handle style structure. For now, MAGS is cooling, but not broken.
S&P 500 technical analysis
The AI split is happening while the broader S&P 500 looks extended.
According to BTIG Chief Market Technician Jonathan Krinsky’s research, the S5INFT signal has only triggered 10 times between 1995 and 2024. The signal tracks moments when the S&P 500 becomes heavily stretched, with RSI above 78 and price trading more than 25% above its 200-day moving average.
Historical S&P 500 Returns After Extreme S5INFT Extension | |
Forward Return | Average Outcome |
5 Days | -1.18% |
10 Days | -1.54% |
20 Days | -1.04% |
30 Days | -1.54% |
40 Days | 0.32% |
Signal conditions
- Average RSI: 79.14.
- Average spread above 200 DMA: 31.58%.
Historically, this type of extension has often led to weaker returns over the following month. It does not always mark a major top, but it does suggest higher pullback or consolidation risk.
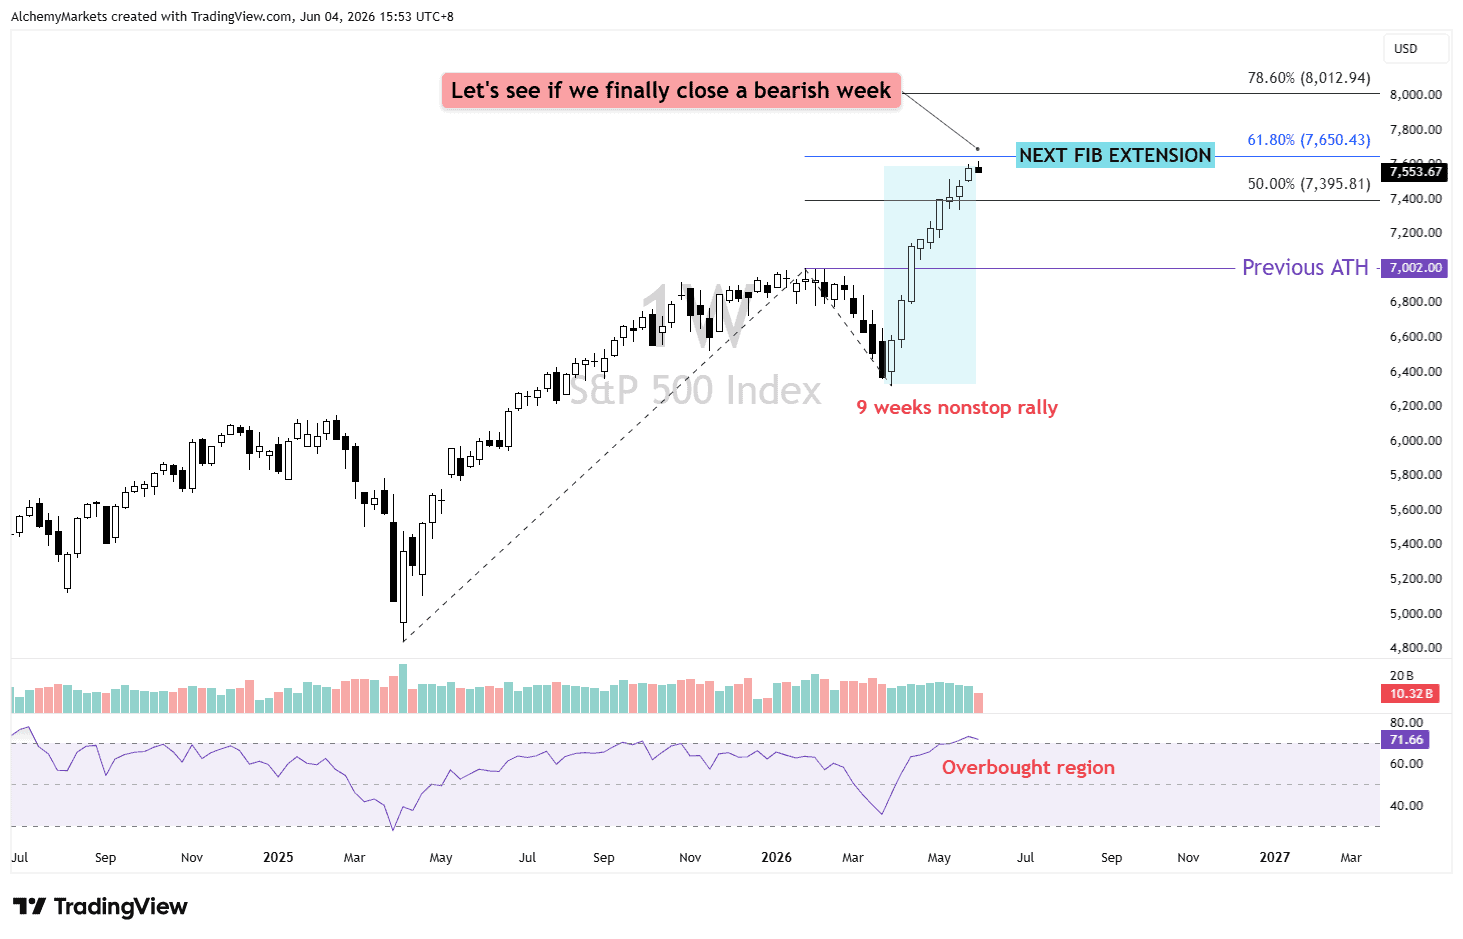
This fits the current S&P 500 setup. After a nine-week rally and a move beyond Tom Lee’s 7,300 target, the index is now trading closer to Fibonacci extension territory.
The 50.0% extension sits near 7,395, while the next major upside reference is the 61.8% extension near 7,650.
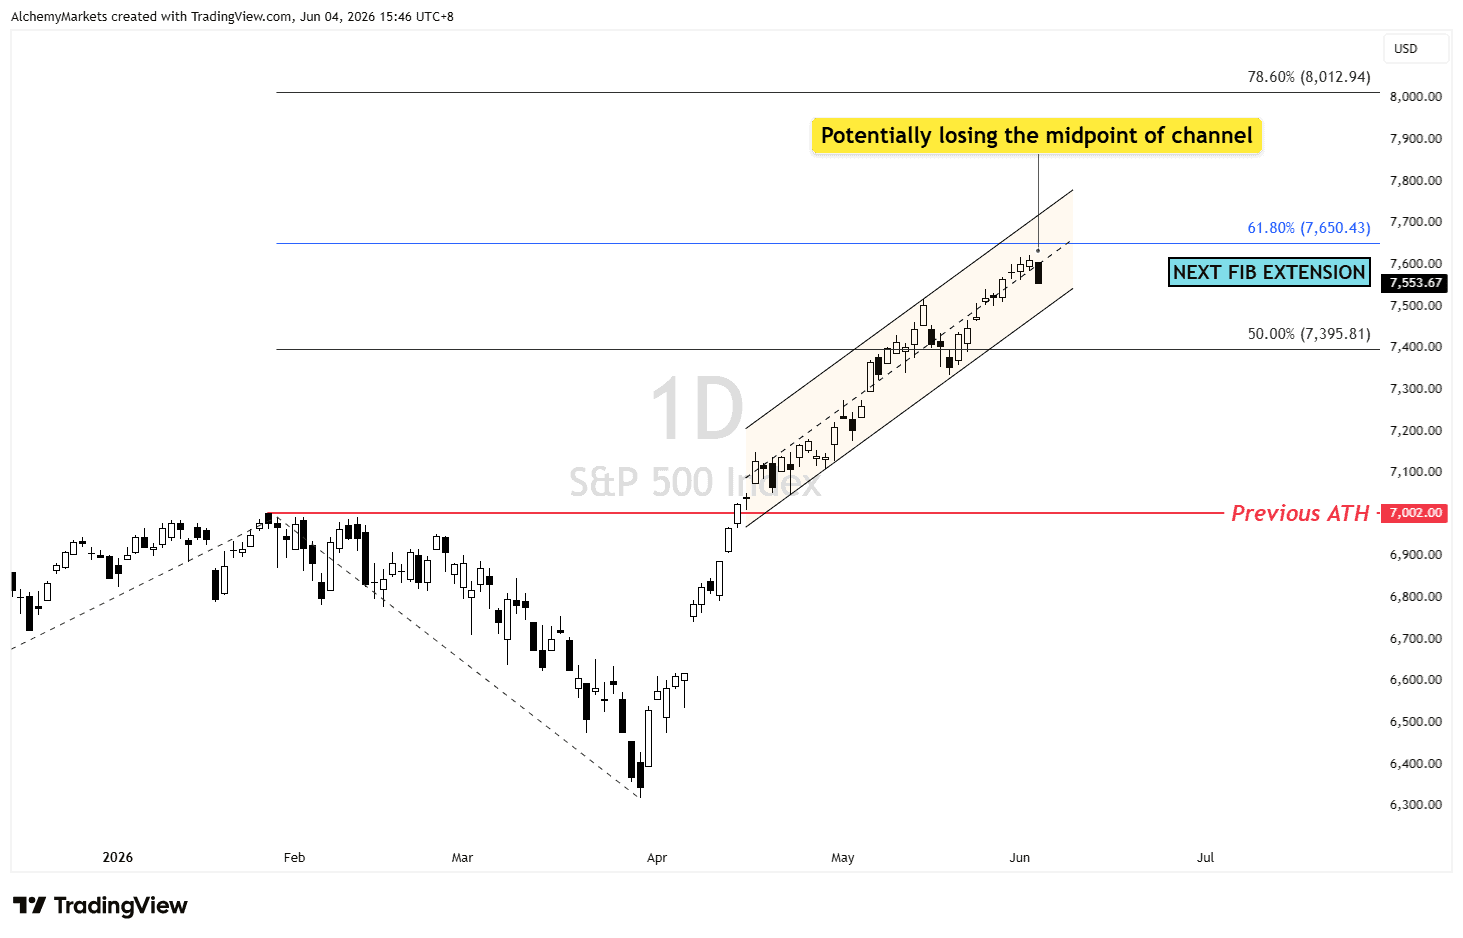
Price is still inside the current rising channel, so this is not a confirmed channel breakdown yet. However, if the S&P 500 closes around current levels, it would suggest a potential loss of the channel midpoint.
That would be an early bearish warning and could bring the 7,300 area back into focus. A deeper correction could expose the psychological 7,000 level.
Bottom line
For traders, the key question is not whether AI is dead. It is whether the market is becoming more selective.
Broadcom’s reaction suggests strong AI results may no longer be enough if guidance does not clear aggressive expectations.
MAGS now becomes the cleaner confirmation chart. If the 68 neckline holds, this may remain a controlled pullback inside a broader uptrend.
If it breaks cleanly, the AI buyer fatigue story becomes harder to ignore.
Author

Zorrays Junaid
Alchemy Markets
Zorrays Junaid has extensive combined experience in the financial markets as a portfolio manager and trading coach. More recently, he is an Analyst with Alchemy Markets, and has contributed to DailyFX and Elliott Wave Forecast in the past.


