AI trade far from over as CoreWeave, Nebius surge on outlook
- CoreWeave surges on expanding margins and rising backlog.
- Nebius Group sees 4x jump in customer commitments.

CoreWeave (CRWV) stock has exploded 21% at the start of trading on Wednesday. The AI cloud computing company beat Wall Street's expectations during its post-market second-quarter earnings release on Tuesday.
CoreWeave reported $-1.14 in GAAP earnings per share (EPS), 33 cents better than consensus. Revenue also narrowly beat the consensus, rising 112% YoY to $2.58 billion. But what has really triggered the Wednesday rally is the rise in CoreWeave's backlog and talk of expanding margins. Q2 saw the revenue backlog increase above $104 billion, but CEO Michael Intrator said that the company had already signed an additional $25 billion in customer commitments in the early weeks of Q3 and that the contribution from this batch was five to ten percentage points better than previous contracts.
While admitting that "near-term capacity was effectively sold out," Intrator said the company remains on track to ramp up from the current 1.5 GW to 8 GW by 2030.
Analysts were enthusiastic with the results.
"We remain positive on CRWV given a strong/diversifying demand backdrop providing a line of sight to meaningful pricing/revenue/margin upside over the medium term as the company transitions from being large scale training GPU compute provider to becoming the AI cloud of choice," wrote Evercore analyst Amit Daryanani.
Evercore retained its $160 price target on CRWV shares, while Wells Fargo hiked its own target by $5 to the same threshold. Truist raised its price target from $126 to $155. The more conservative analysts at Bernstein also raised their price target from $67 to $74, while Barclays hiked their target from $90 to $105.
Nebius witnesses similar success in Europe
Nebius Group (NBIS), the Netherlands-based European counterpart to CoreWeave, also released a shockingly impressive quarterly report. Nebius Group shares have jumped 18% at the time of writing on Wednesday after the company reported Q2 GAAP EPS of -$0.68, or $0.18 better than consensus. Revenue exploded off a low base by $454% YoY to $582 million, besting the consensus by over $8 million.
More importantly, Nebius management upped their forecast for year-end infrastructure by a whole gigawatt to 5 GW. The CEO said total contract value of all deals secured in Q2 quadrupled from the prior quarter, and the contract deals for new customers saw a 9X increase.
What's more, the expected payback period for the current wave of extremely high capex is now one year and ten months compared to the two to three-year payback period announced in Q1.
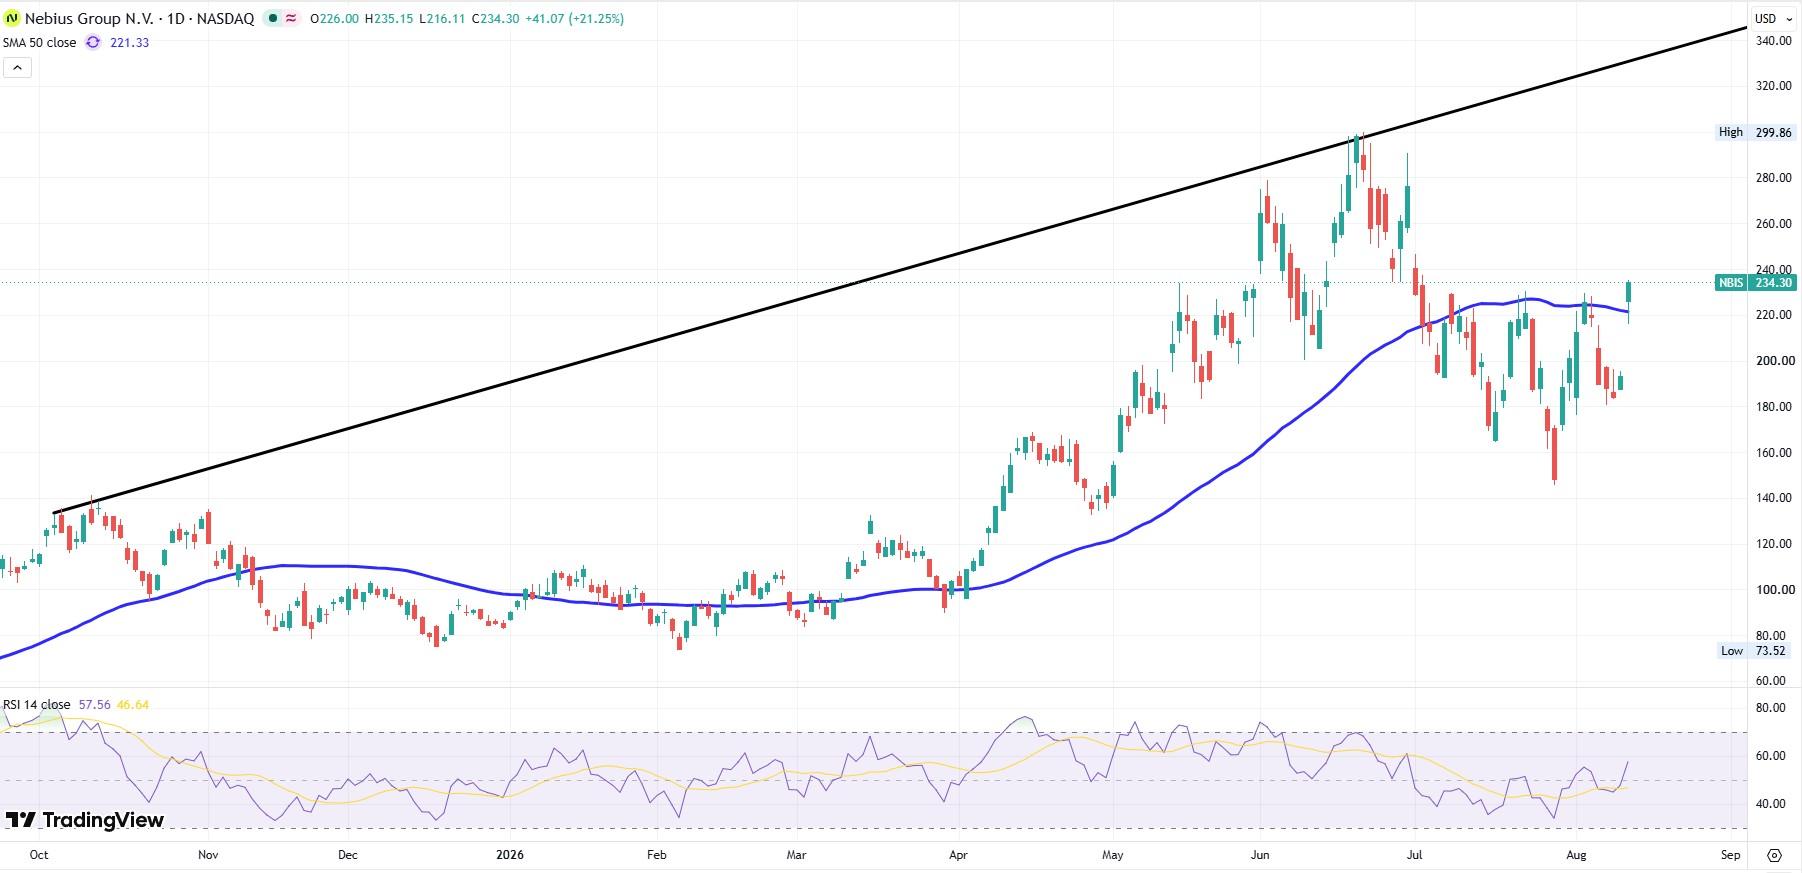
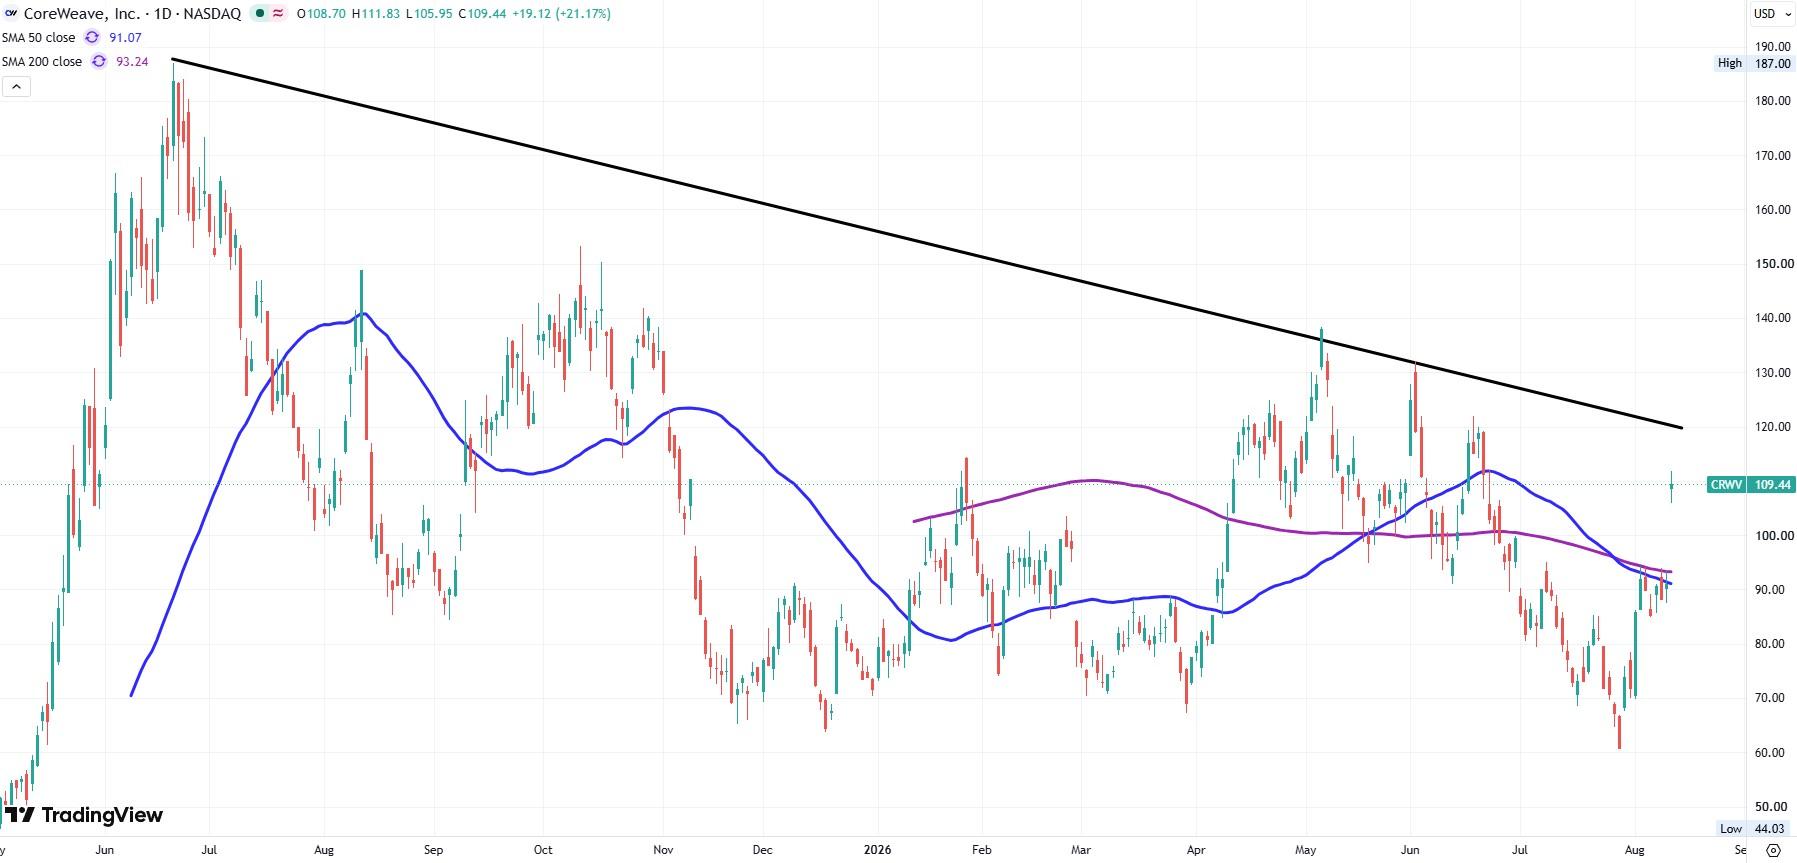
Nebius and CoreWeave stock charts
Nebius stock has already turned the page with Wednesday's spike. Shares of NBIS surged above the previous lower-high resistance surrounding $230. The jump in the share price has already placed it above the 50-day Simple Moving Average (SMA), a bullish construct if it can hold through the close.
If this rally has staying power, then bulls will hold out for a break of June's previous all-time high just below $300. The long-term trendline gives us a proposed resistance point around $340.
CoreWeave stock has been in a downtrend for the last 14 months, but Wednesday's spike has got to give long-time bag-holders some hope. Now that CoreWeave trades well above the 50-day SMA, and 200-day SMA for that matter, bulls need to see a break above the descending top trendline near $120 for this rally to continue through August.
Author

Clay Webster
FXStreet
Clay Webster grew up in the US outside Buffalo, New York and Lancaster, Pennsylvania. He began investing after college following the 2008 financial crisis.
















