AAPL perfect reaction higher from blue box area [Video]
![AAPL perfect reaction higher from blue box area [Video]](https://editorial.fxstreet.com/images/Markets/Bonds/Euribor/trading-stocks-and-money-57180388.jpg)
In this technical blog, we will look at the past performance of the 1-hour Elliott Wave Charts of AAPL. We presented to members at the elliottwave-forecast. In which, the rally from 19 April 2024 low is unfolding as an impulse structure. Showing a higher high sequence favored more upside extension to take place. Therefore, we advised members not to sell the stock & buy the dips in 3, 7, or 11 swings at the blue box areas. We will explain the structure & forecast below:
AAPL one-hour Elliott Wave chart from 6.23.2024
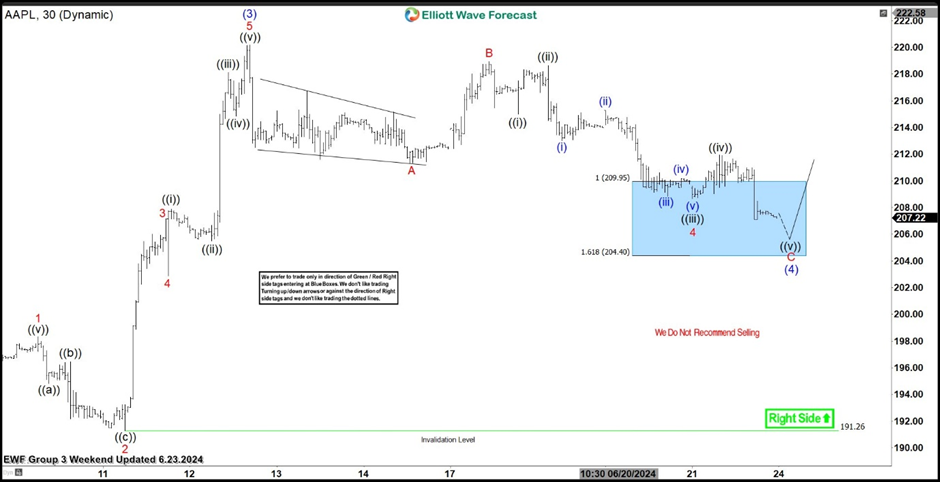
Here’s the 1-hour Elliott wave chart from the 6.23.2024 weekend update. In which, the short-term cycle from the 5.23.2024 low ended in wave (3) at $220.20 high. Down from there, the stock made a pullback in wave (4) to correct that cycle. The internals of that pullback unfolded as Elliott wave zigzag structure where wave A ended at $211.30 low. Wave B bounce ended at $218.95 high and wave C managed to reach the blue box area at $209.95- $204.40. From there, buyers were expected to appear looking for the next leg higher or for a 3 wave bounce minimum.
AAPL latest one-hour Elliott Wave chart from 7.01.2024
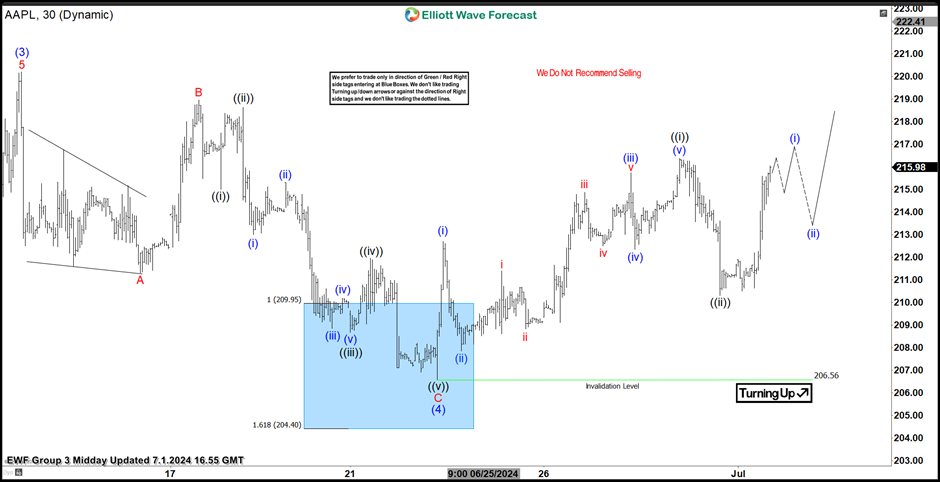
This is the latest 1-hour Elliott wave Chart from the 7.01.2024 Midday update. In which the stock is showing a reaction higher taking place, right after ending the zigzag correction within the blue box area. Allowed members to create a risk-free position shortly after taking the long position at the blue box area. However, a break above $220.20 high is still needed to confirm the next extension higher & avoid a double correction lower.
Author

Elliott Wave Forecast Team
ElliottWave-Forecast.com


