United States Dollar Index holds above 102, remains supported by firm bond yields
- The US Dollar reflects strength against its peers due to firm US Treasury Yields.
- The selling pressure in US bond remains elevated due to persistent inflation fears.
- Investors shift their focus to the FOMC minutes of the September meeting scheduled for Wednesday.

The US Dollar (USD) trades broadly firm against its major currency peers as United States (US) bond yields remain higher due to persistent inflation fears.
As of writing, the US Dollar Index (DXY), which gauges the Greenback’s value against six major currencies, trades 0.1% higher to near 102.20. The DXY is close to its annual high of 102.54 posted on Monday. 10-Year US Treasury Yields are up 0.24% to near 5.32%, close to its fresh two-decade high of 5.35% posted on Monday.
US Dollar Price Today
The table below shows the percentage change of US Dollar (USD) against listed major currencies today. US Dollar was the strongest against the British Pound.
| USD | EUR | GBP | JPY | CAD | AUD | NZD | CHF | |
|---|---|---|---|---|---|---|---|---|
| USD | 0.03% | 0.08% | 0.06% | 0.02% | -0.01% | 0.02% | 0.06% | |
| EUR | -0.03% | -0.01% | 0.02% | -0.02% | -0.02% | -0.02% | 0.03% | |
| GBP | -0.08% | 0.00% | 0.04% | -0.03% | -0.02% | -0.02% | 0.05% | |
| JPY | -0.06% | -0.02% | -0.04% | -0.05% | -0.07% | -0.04% | 0.01% | |
| CAD | -0.02% | 0.02% | 0.03% | 0.05% | -0.03% | -0.01% | 0.05% | |
| AUD | 0.00% | 0.02% | 0.02% | 0.07% | 0.03% | -0.00% | 0.08% | |
| NZD | -0.02% | 0.02% | 0.02% | 0.04% | 0.01% | 0.00% | 0.08% | |
| CHF | -0.06% | -0.03% | -0.05% | -0.01% | -0.05% | -0.08% | -0.08% |
The heat map shows percentage changes of major currencies against each other. The base currency is picked from the left column, while the quote currency is picked from the top row. For example, if you pick the US Dollar from the left column and move along the horizontal line to the Japanese Yen, the percentage change displayed in the box will represent USD (base)/JPY (quote).
The selling pressure in US bonds remains intensified even as soft Nonfarm Payrolls (NFP) data for September has forced traders to scale back hawkish Federal Reserve (Fed) expectations. Financial markets argue that Fed’s interest rate expectations rely more on inflation projections than labor market conditions in the latest scenario.
Societe Generale’s Kenneth Broux argues that the softer US payrolls report has reinforced the recent pullback in expectations for near‑term Fed tightening, but the bank stresses that it is “not a game changer for the hawkish predisposition of the Fed – inflation is the bogeyman.” In their view, the latest jobs print instead “justifies caution over cadence and quantity of future policy adjustments.
For fresh cues regarding the Fed’s monetary policy outlook, investors will focus on the Federal Open Market Committee (FOMC) minutes of the September meeting, which will be released on Wednesday.
On the economic data front, the ISM Services Purchasing Managers’ Index (PMI) data for September has come in weaker than estimates. The Service PMI arrives at 54.9, lower than expectations of 55.0 and the previous reading of 55.4.
US Dollar Index Technical Analysis
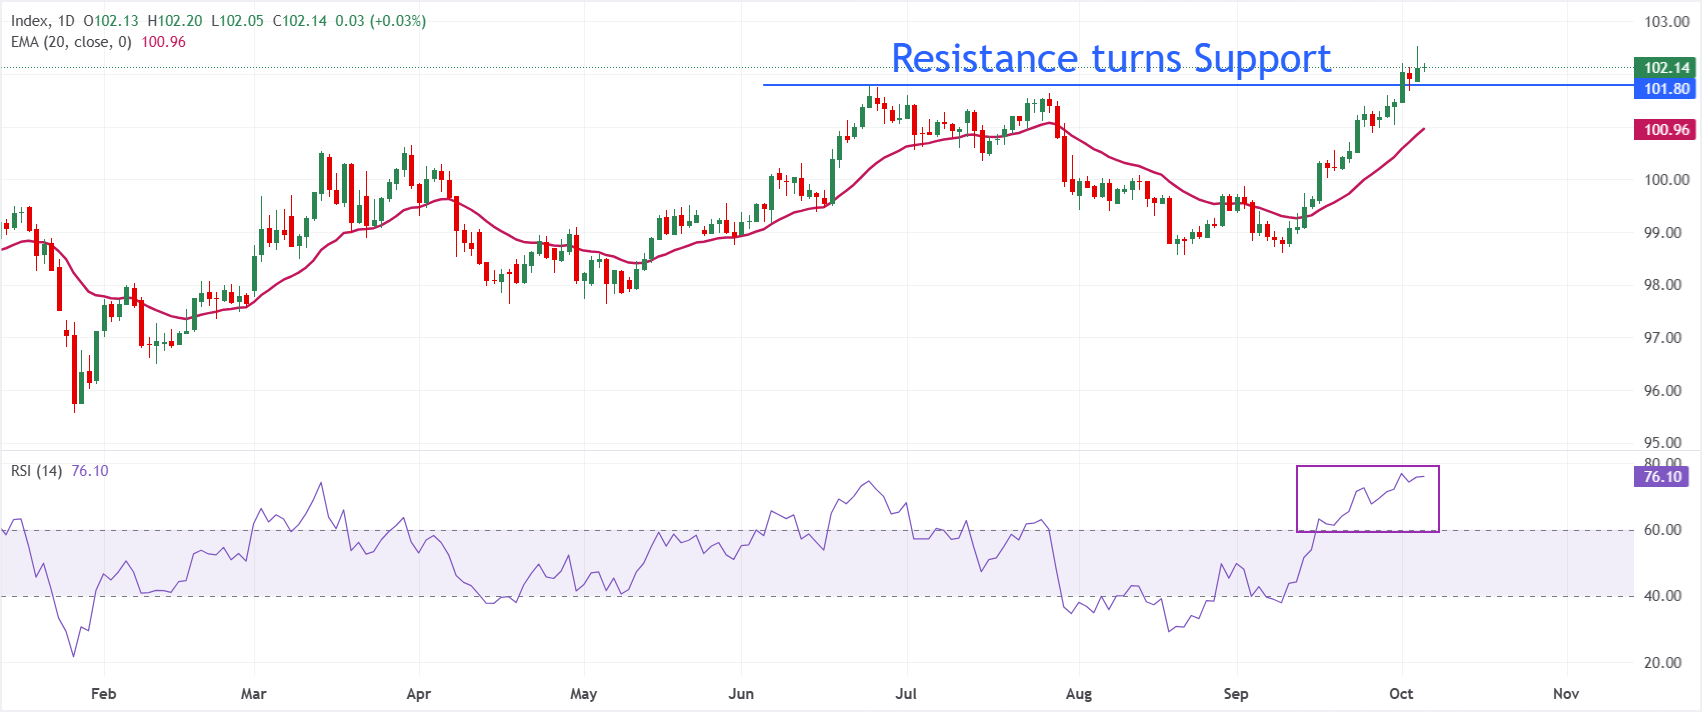
In the daily chart, Dollar Index Spot trades at 102.14. The near-term bias is bullish as price holds clearly above the 20-day exponential moving average (EMA) at 100.96, reinforcing an ongoing advance after reclaiming the 100.00 region.
The Relative Strength Index (14) at 76.10 sits in overbought territory, hinting that upside momentum is strong but increasingly stretched.
On the downside, initial support is the June 24 high at 101.80 before the 20-day EMA around 100.96. On the upside, the annual high at 102.54 is the major hurdle.
(The technical analysis of this story was written with the help of an AI tool. Know more.)
Economic Indicator
FOMC Minutes
FOMC stands for The Federal Open Market Committee that organizes 8 meetings in a year and reviews economic and financial conditions, determines the appropriate stance of monetary policy and assesses the risks to its long-run goals of price stability and sustainable economic growth. FOMC Minutes are released by the Board of Governors of the Federal Reserve and are a clear guide to the future US interest rate policy.
Next release: Wed Oct 07, 2026 18:00
Frequency: Irregular
Consensus: -
Previous: -
Source: Federal Reserve
Minutes of the Federal Open Market Committee (FOMC) is usually published three weeks after the day of the policy decision. Investors look for clues regarding the policy outlook in this publication alongside the vote split. A bullish tone is likely to provide a boost to the greenback while a dovish stance is seen as USD-negative. It needs to be noted that the market reaction to FOMC Minutes could be delayed as news outlets don’t have access to the publication before the release, unlike the FOMC’s Policy Statement.
Author

Sagar Dua
FXStreet
Sagar Dua is associated with the financial markets from his college days. Along with pursuing post-graduation in Commerce in 2014, he started his markets training with chart analysis.