Dollar Index fades from 19-month high after retail sales spike
- DXY hits a 19-month high on retail sales and gives back the whole spike.
- A December Fed hike was fully priced, and weak factory data pulled yields back.
- Minutes of the Fed's October meeting on Wednesday come next for hike bets.


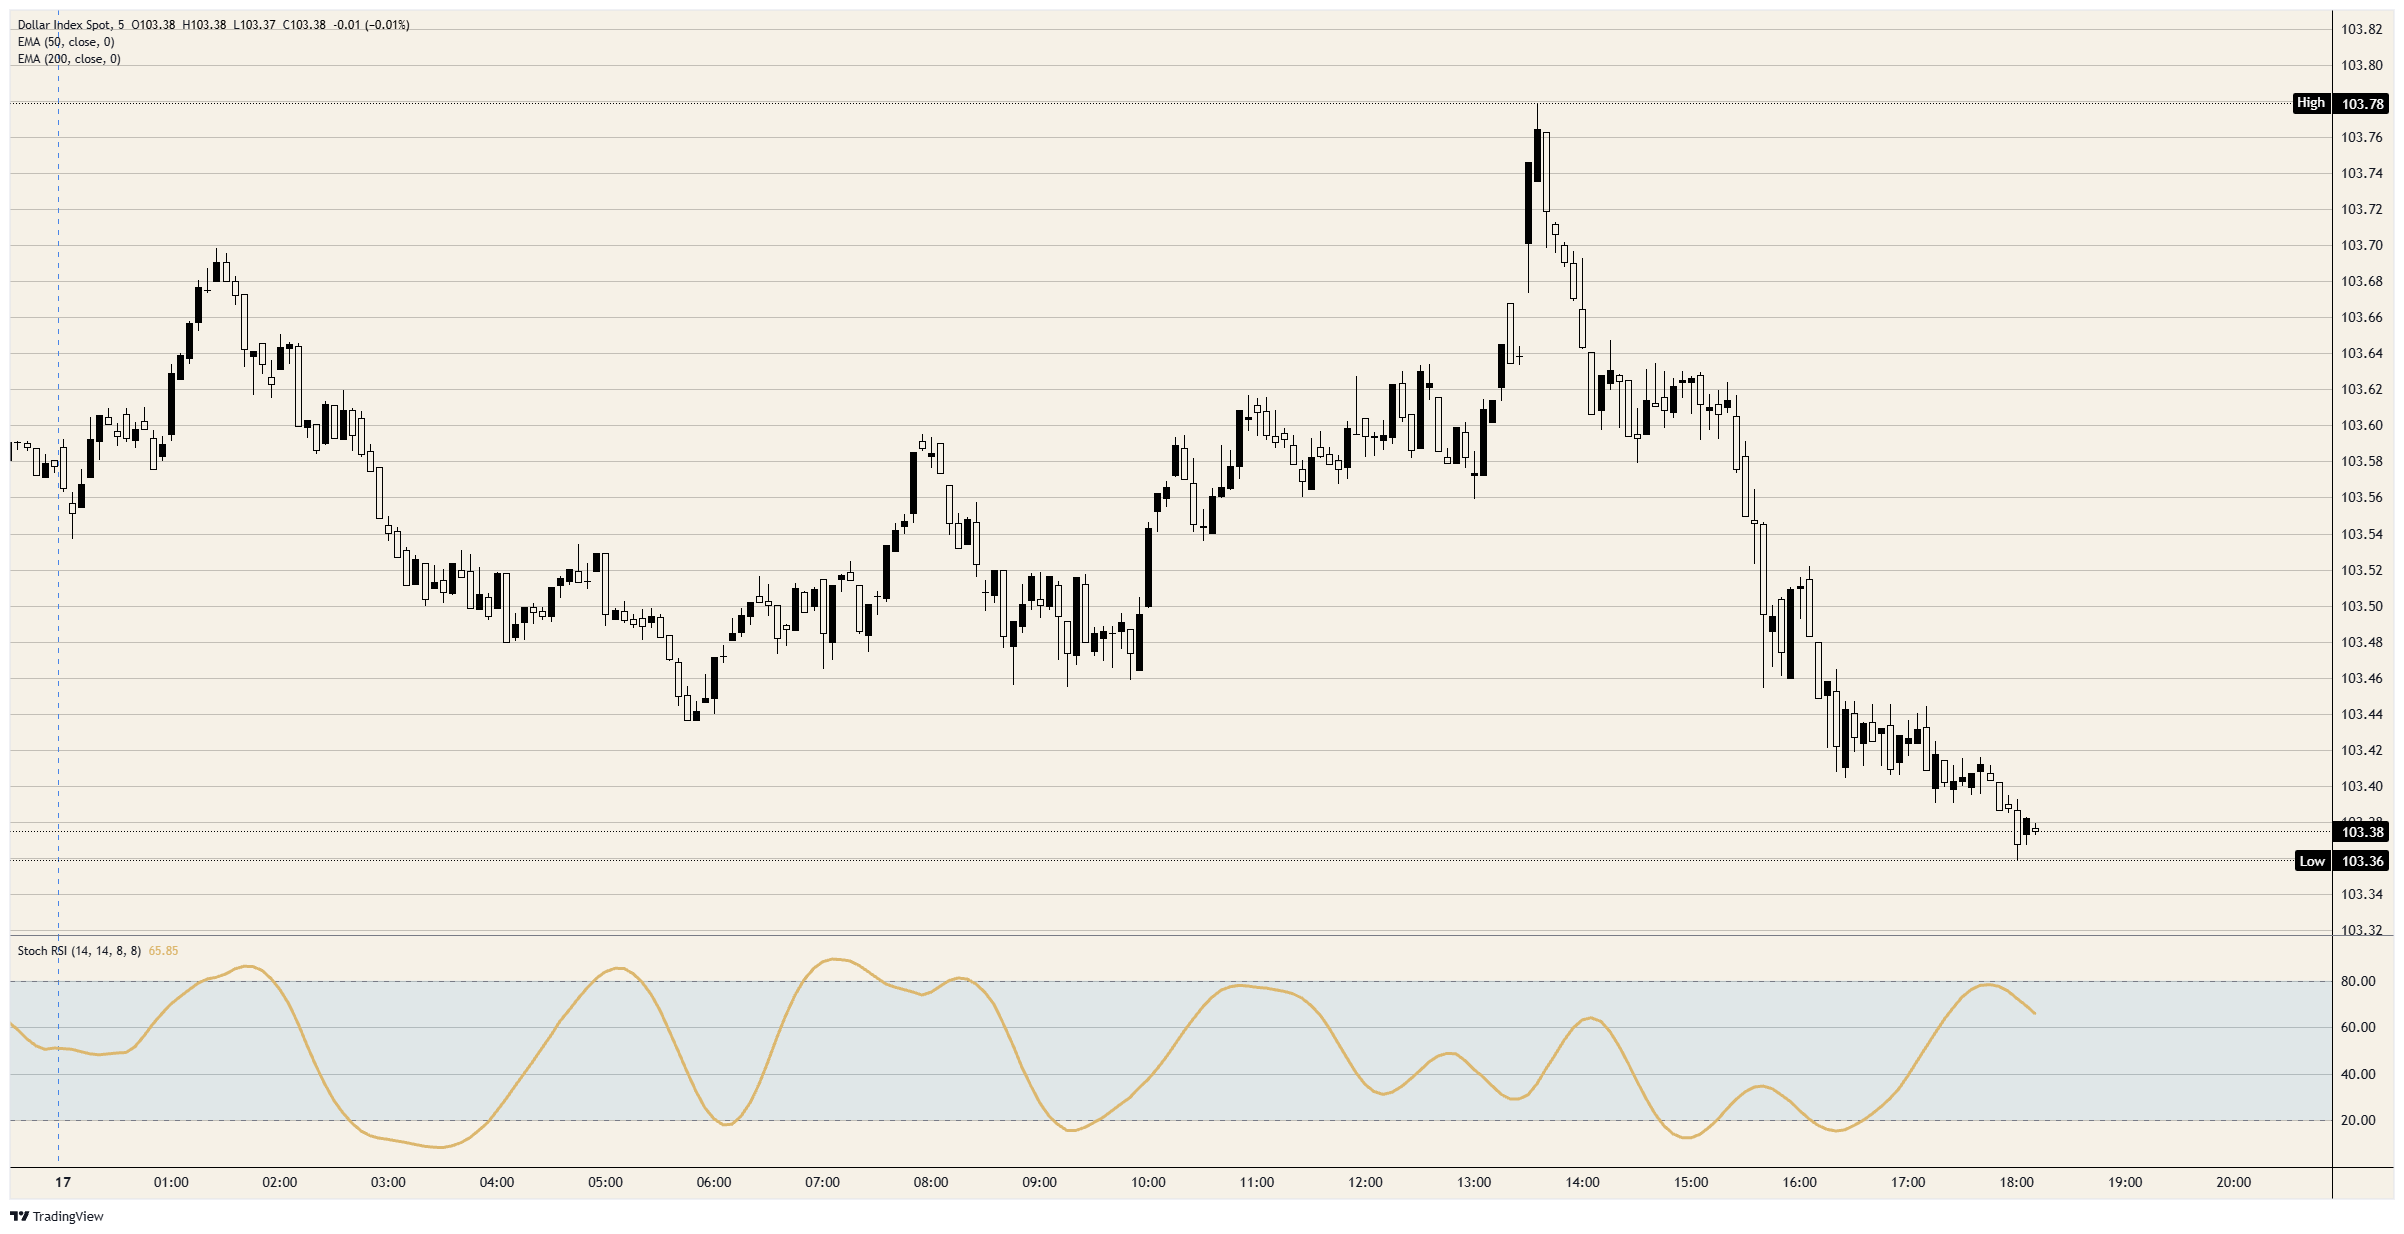
A fresh 19-month high in the US Dollar Index (DXY) didn't last until the next data release, and the index is on track to snap a five-session winning streak on Tuesday. It rose to just under 103.80 on October retail sales, its highest since April 2025, and the whole spike was gone before industrial production came out. A second slide has since taken it to around 103.40.
Retail sales rose 0.2% in October, but the control group rose 0.6% and its September gain was revised up to 0.5%. Import prices rose 1.1% for a second month. Traders had already priced a December Fed hike in full, near 91% for a quarter-point on CME FedWatch, so strong numbers had little left to add to the Dollar.
Industrial production fell 0.4% in October after a 0.7% rise, and the homebuilder sentiment index dropped to 25 from 29. Treasury yields gave back their rise for the session, with the 10-year near 5.13%. The Dollar's second slide began after the homebuilder number, and it continued after Cleveland Fed President Hammack said inflation is moving in the wrong direction.
On the calendar
Minutes of the Fed's October 27-28 meeting, where it held its rate at 3.75%-4.00%, are due at 19:00 GMT on Wednesday. New York Fed President John Williams speaks the same day, and Cleveland Fed President Beth Hammack, Chicago Fed President Austan Goolsbee and Philadelphia Fed President Anna Paulson speak on Thursday. With a December 9 hike priced in full, what they can still move is the bet on a half-point, near 9% on CME FedWatch.
Nvidia (NVDA) reports at 21:20 GMT on Tuesday. Analysts at ING said the fall in US tech stocks has spread to enough other stock markets for the Dollar to gain as a haven. Weekly jobless claims follow at 13:30 GMT on Thursday.
On the charts
The drop from the high is less than a fifth of the climb from the November 10 low near 101.50, and the index is back inside Monday's range. It's also above the October 14 peak just under 103.00, which it cleared on November 12. The 50-day Exponential Moving Average (EMA) is near 101.70 and the 200-day is near 100.40.
DXY 5-minute chart
US Dollar FAQs
The US Dollar (USD) is the official currency of the United States of America, and the ‘de facto’ currency of a significant number of other countries where it is found in circulation alongside local notes. It is the most heavily traded currency in the world, accounting for over 88% of all global foreign exchange turnover, or an average of $6.6 trillion in transactions per day, according to data from 2022. Following the second world war, the USD took over from the British Pound as the world’s reserve currency. For most of its history, the US Dollar was backed by Gold, until the Bretton Woods Agreement in 1971 when the Gold Standard went away.
The most important single factor impacting on the value of the US Dollar is monetary policy, which is shaped by the Federal Reserve (Fed). The Fed has two mandates: to achieve price stability (control inflation) and foster full employment. Its primary tool to achieve these two goals is by adjusting interest rates. When prices are rising too quickly and inflation is above the Fed’s 2% target, the Fed will raise rates, which helps the USD value. When inflation falls below 2% or the Unemployment Rate is too high, the Fed may lower interest rates, which weighs on the Greenback.
In extreme situations, the Federal Reserve can also print more Dollars and enact quantitative easing (QE). QE is the process by which the Fed substantially increases the flow of credit in a stuck financial system. It is a non-standard policy measure used when credit has dried up because banks will not lend to each other (out of the fear of counterparty default). It is a last resort when simply lowering interest rates is unlikely to achieve the necessary result. It was the Fed’s weapon of choice to combat the credit crunch that occurred during the Great Financial Crisis in 2008. It involves the Fed printing more Dollars and using them to buy US government bonds predominantly from financial institutions. QE usually leads to a weaker US Dollar.
Quantitative tightening (QT) is the reverse process whereby the Federal Reserve stops buying bonds from financial institutions and does not reinvest the principal from the bonds it holds maturing in new purchases. It is usually positive for the US Dollar.
Author
Joshua Gibson
FXStreet
Joshua joins the FXStreet team as an Economics and Finance double major from Vancouver Island University with twelve years' experience as an independent trader focusing on technical analysis.

















