Accenture has risen for 12 straight sessions. Is it time to sell?
- ACN rises for the 12th consecutive day on Thursday.
- Accenture stock closes the gap formed on February 3.
- RSI reaches overbought territory on both daily and weekly charts.

Accenture (ACN) shares are having a moment. While much of the rest of the market has been preoccupied with the downturn in AI stocks in October, Accenture shares have jetted ahead 37% at last count. The consulting giant looks set to capture its 12th straight up day as shares close a significant gap down on the daily chart from the start of the year.
Any stock that rises for 12 daily sessions in a row is historically anomalous. It's rare enough that it typically only happens once or twice for any S&P 500 stock over the course of multiple decades.
Accenture fell 9.6% on February 3, when Anthropic released a new set of AI automation tools that the market believed would disrupt consulting business models. ACN shares had already declined about 32% over the previous year (since February 2025) due to similar concerns over AI competition with Accenture's bread-and-butter IT consulting services.
ACN reached a range low in June near $115 before rising more than 100% over the following four months. But with a major quarterly earnings beat and a hike to the outlook on October 1, ACN stock launched the present leg of its rally that culminated on Thursday in closing the gap with the February 2026 sell-off. Shares rallied more than 5% on Thursday to an intraday high above $254 even as the NASDAQ Composite plunges some 2.8%.
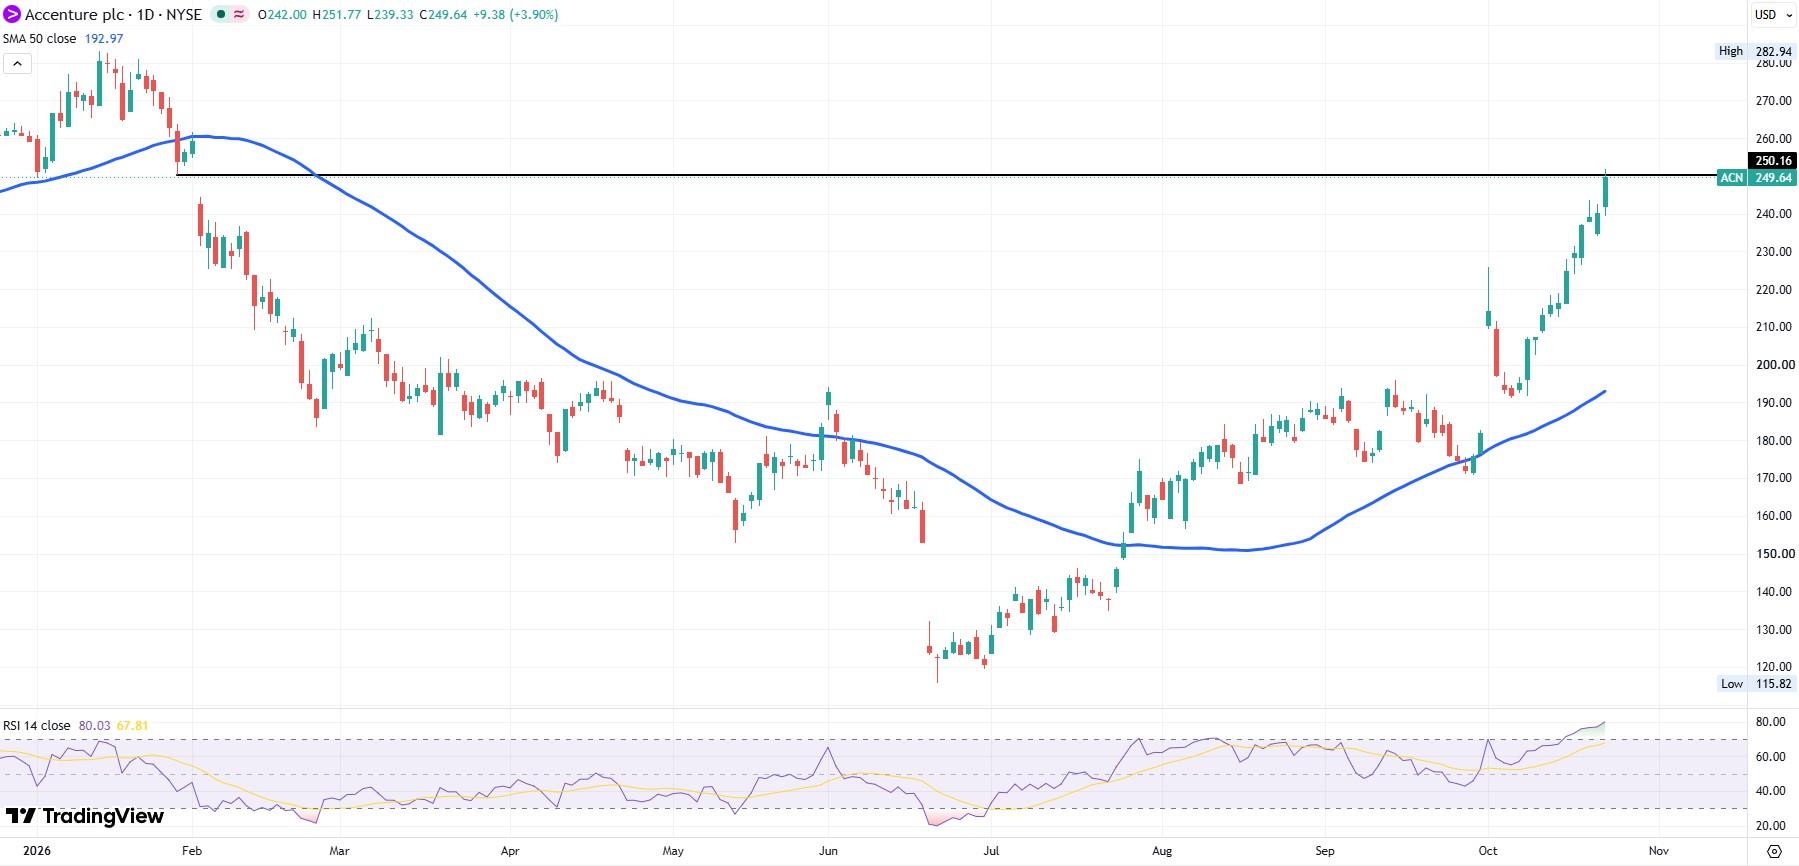
But this is where bulls have a decision to make. The Relative Strength Index (RSI) offers a severely overbought reading of 80 on Thursday. That hasn't happened since August of 2020. After 12 straight days of rising price levels and a technical gap at $250 closed, bulls should now expect some profit-taking to ensue. The daily chart has moved ACN well off its 50-day Simple Moving Average (SMA), and the most likely next step is a retest of that SMA before year-end.
The weekly chart below also showcases an overbought RSI reading of 72 on the chart for this week's candle. That level hasn't been tested since December 2022.
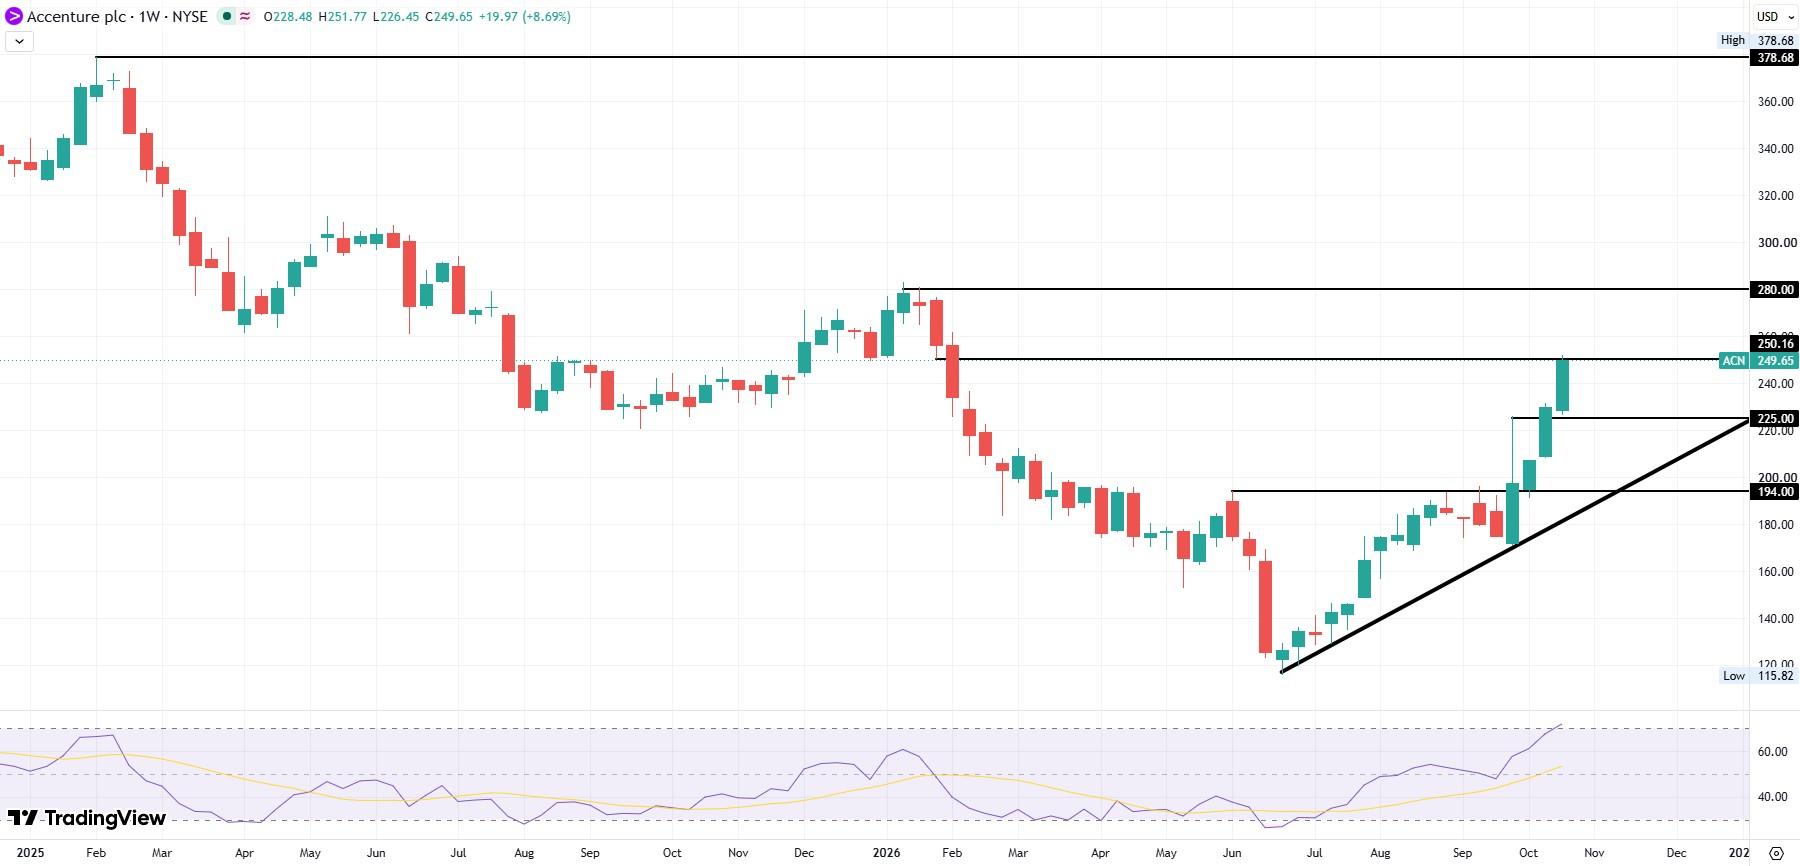
If this analysis is correct, traders should expect ACN to consolidate in the next few sessions. One such band of support sits near $225, the immediate intraday high from the October 1 earnings spike that could turn into support. If selling is strong enough, then a further drop could push ACN down to the $194 level, where the 50-day SMA coincides with resistance witnessed in June and September. If the chart wanted to thrill a TA nerd, then the timing would fall in mid-November when the ascending bottom trendline bisects that $194 resistance level.
Of course, if a sell-off doesn't occur soon, then ACN will probably tag the $280 resistance level from January of this year.
Author

Clay Webster
FXStreet
Clay Webster grew up in the US outside Buffalo, New York and Lancaster, Pennsylvania. He began investing after college following the 2008 financial crisis.