|

Trading patterns explained: Types, examples, and how traders use them

Most common trading patterns

Below are some of the most widely used and reliable trading patterns across financial markets.

Ascending triangle

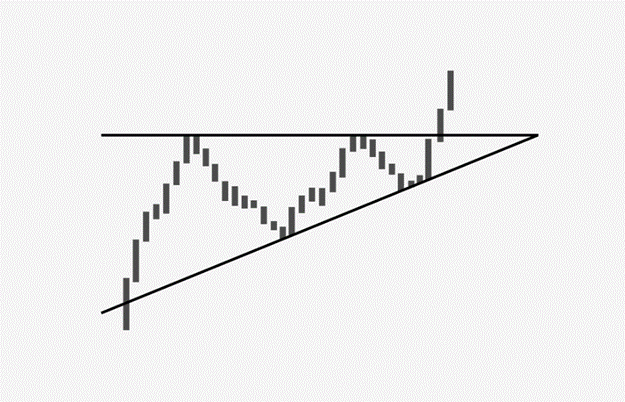
The ascending triangle is a bullish continuation pattern.

Key characteristics:

  • Flat resistance line.
  • Rising support line.
  • Increasing buying pressure.
Chart
Chart

A breakout above resistance often signals continuation of the uptrend.

Descending triangle

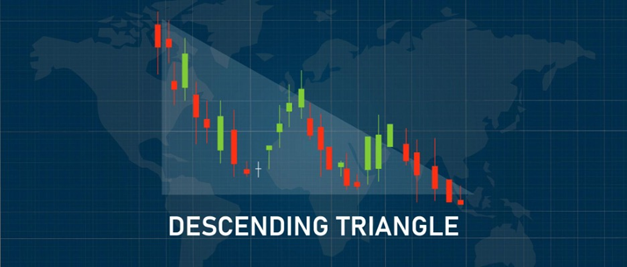
The descending triangle is typically a bearish continuation pattern.

Key characteristics:

  • Flat support line.
  • Descending resistance line.
  • Increasing selling pressure.
Chart

A breakdown below support often leads to further downside.

Symmetrical triangle

The symmetrical triangle forms when price compresses between:

  • Rising support.
  • Falling resistance.
Chart
Chart

This pattern signals indecision, and breakouts can occur in either direction. Traders often wait for confirmation before entering.

Pennant

Pennants form after strong price moves and represent short consolidation phases.

Key characteristics:

  • Sharp impulsive move.
  • Brief consolidation.
  • Continuation in the original direction.
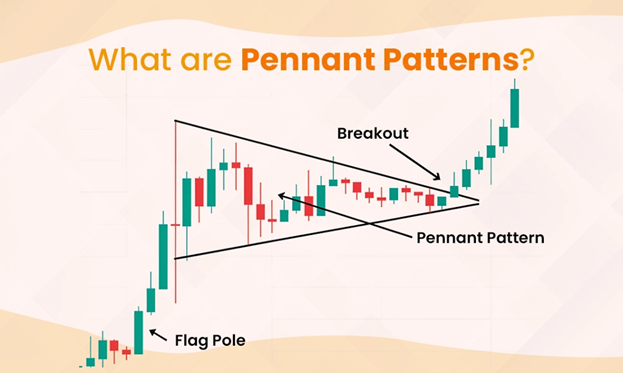
Chart

Pennants often appear in trending markets.

Flag pattern

The flag pattern resembles a small channel moving against the prevailing trend.

Despite the temporary counter-trend movement, the breakout usually occurs in the direction of the original trend, making it a continuation pattern.
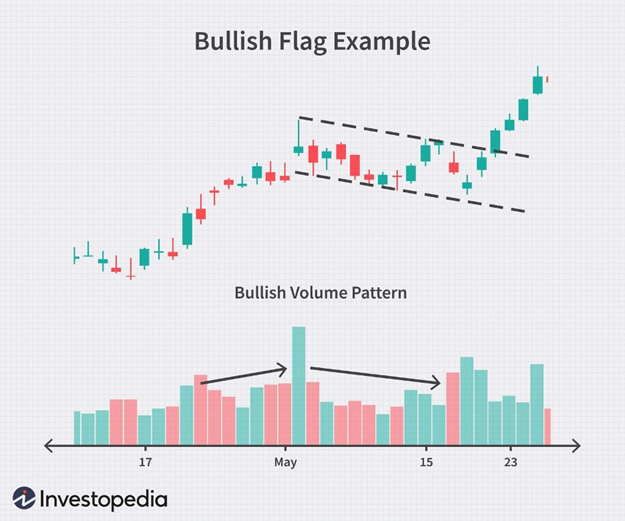
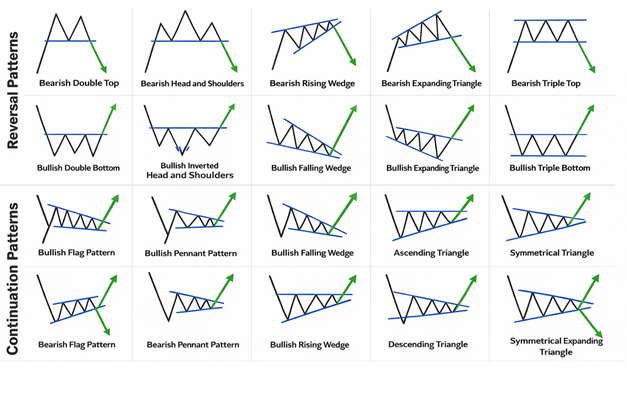
Chart
Chart

Double bottom

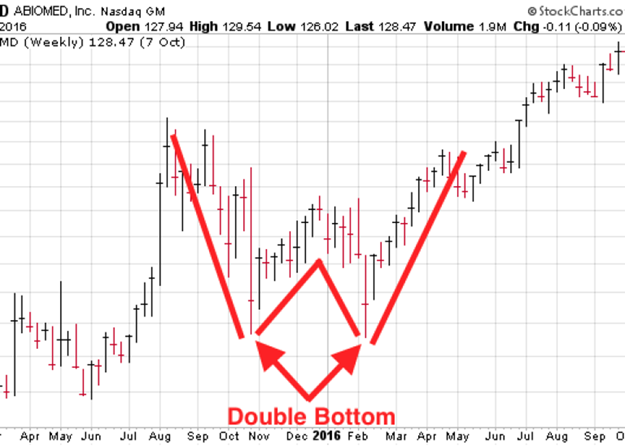
The double bottom resembles the letter “W” and signals a potential bullish reversal.

Key characteristics:

  • Two failed attempts to break support.
  • Increasing buying pressure.
  • Break above resistance confirms reversal.
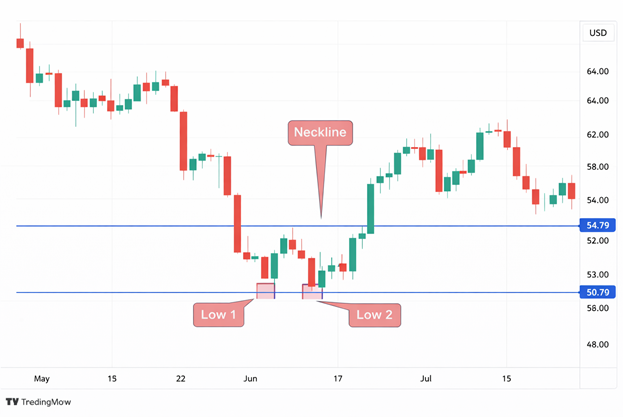
Chart
Chart

Double top

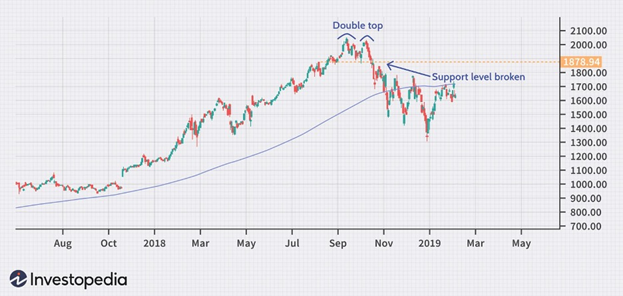
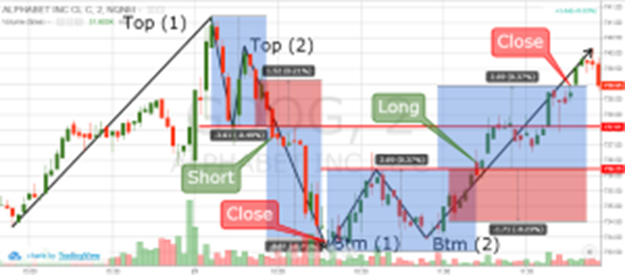
The double top resembles the letter “M” and signals a potential bearish reversal.

After two failed attempts to break resistance, price often reverses downward.
Chart
Chart

Download the full article here

Author

Elliott Wave Forecast Team

Elliott Wave Forecast Team

ElliottWave-Forecast.com

More from Elliott Wave Forecast Team
Share:

Editor's Picks

XRP retreats as ETF interest cools
Ripple (XRP) slides toward the short-term $1.10 support on Friday, as broader crypto market sentiment weighs on crypto assets. The sell-off mainly stems from fears of inflation in the United States (US) amid the ongoing war in the Middle East and rising Oil prices.
Crypto Today: Bitcoin, Ethereum, XRP pare losses as breakout potential builds
Bitcoin (BTC) is edging higher on Friday, albeit gradually, after reclaiming support above $65,000. Meanwhile, Ethereum (ETH) shows signs of stability near the immediate $1,900 hurdle, backed by mild capital inflows. Ripple (XRP), on the other hand, holds above the pivotal $1.10, with its upside structurally constrained below $1.15.
Bitcoin Weekly Forecast: BTC holds firm, but the $100 Oil threat could change the game
Bitcoin (BTC) is modestly recovering, trading at $65,400 on Friday and holding firmly above the key support zone. US-listed spot Bitcoin Exchange Traded Funds (ETFs) supported BTC’s modest recovery as they continued to attract institutional inflows through Thursday, pointing to the third consecutive week of inflows.
Crypto shrugs off a stronger Dollar
Cryptocurrencies have been affected by jitters in traditional financial markets, losing 0.8% of their market capitalisation over the past 24 hours to $2.23T, dipping to a low of $2.21T at the start of active trading in Asia.
Bitcoin: BTC holds firm, but the $100 Oil threat could change the game
Bitcoin (BTC) is modestly recovering, trading at $65,400 on Friday and holding firmly above the key support zone. US-listed spot Bitcoin Exchange Traded Funds (ETFs) supported BTC’s modest recovery as they continued to attract institutional inflows through Thursday, pointing to the third consecutive week of inflows.