Pivotal
Newer traders sometimes struggle when trying to identify supply and demand zones. My best advice is to practice and see if your zones are lining up with those identified by your instructors in the Extended Learning Track.
There is also an additional method to identify potential turning points in the markets. This method is not to replace identifying supply and demand, but is rather a way to supplement and perhaps to confirm those levels. This is not a magical tool that will work all the time. The tool/method I am talking about is floor trader pivot points.
The pivot points were created to give professional floor traders at exchanges a way to determine possible support and resistance without having to refer to charts. The pivot point itself is simply the previous day’s high + the previous day’s low + the previous day’s close divided by three. This pivot point can act as a support or resistance level for price and can be applied to equities, forex, and futures charts. Wait a minute! Not so fast, don’t the futures and forex trade 24 hours a day? How can we get a close price? Actually, the trade price at 5:00PM New York time (EST) is used as the “closing time” for our calculations.
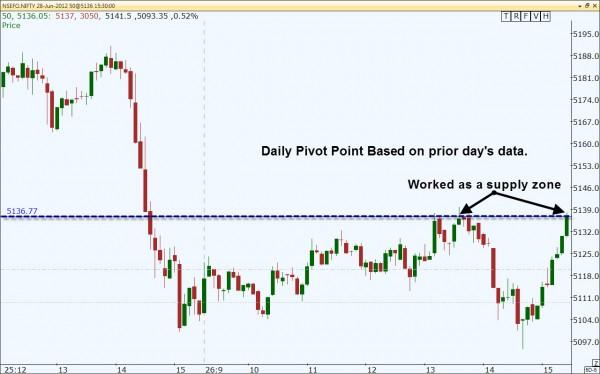
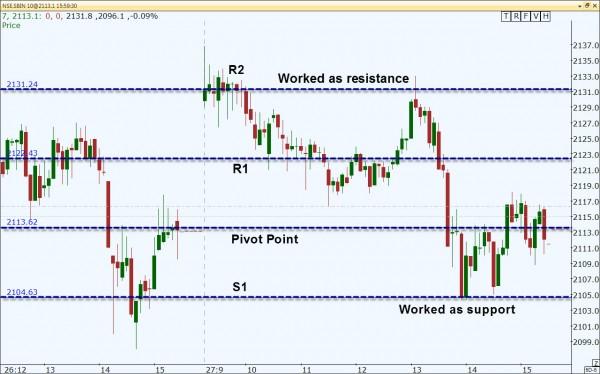
By using this pivot point number and some additional mathematical calculations, we can derive several additional support and resistance numbers. In fact, there are calculations for four support and resistance levels. We can use these pivot support and resistance as possible entry and target points for trading.
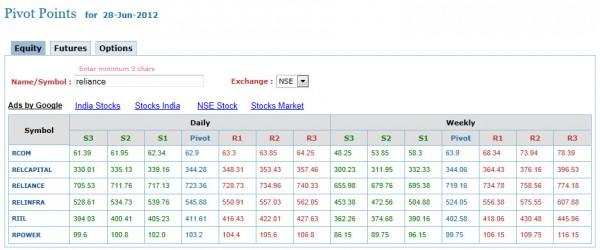
Some trading platforms automatically draw pivot points on your chart for you, but if you are creating your trading plans the night before, you can easily add the pivots to your chart. There are several websites that will give you the pivot points. One that I like is www.bigpaisa.com. On the site, you can get the daily and weekly pivots for any NSE or BSE security.

Although the main use for the pivots is intraday charting, you could plug in the weekly or even the monthly high, low, and close to determine the future support and resistance for swing and position trading. One thing to remember: these pivot points should not take the place of the support and resistance you visually identify on your charts. Those turning points were caused by the emotions of investors and traders and therefore carry more weight. These people will remember how they triumphed or were hurt at those price levels. Since pivot points do not carry those same emotions with them, they only work if traders believe they work and act in the same manner when price reached those levels.
Fortunately, they have gained enough popularity that they are almost a self-fulfilling prophecy on many stocks and markets. So while not the end all, pivot points could help you determine the turning points of a stock, sector, index, currency, etc. This can be a valuable tool in your trading arsenal. So until next time, may all your trades be green and your losses small!
Author

Brandon Wendell, CMT
Brandon Wendell
Brandon started off in the industry as a retail stockbroker working the phones. With a thirst to learn more about market mechanics, he moved into back-office operations handling order flow as an Agency Desk Operator for a major brokerage.














