Ripple and Stellar outlook: XRP and XLM extend losses as US inflation data weighs in
- XRP extends its correction on Thursday, slipping below the key EMA clusters as bearish pressure intensifies.
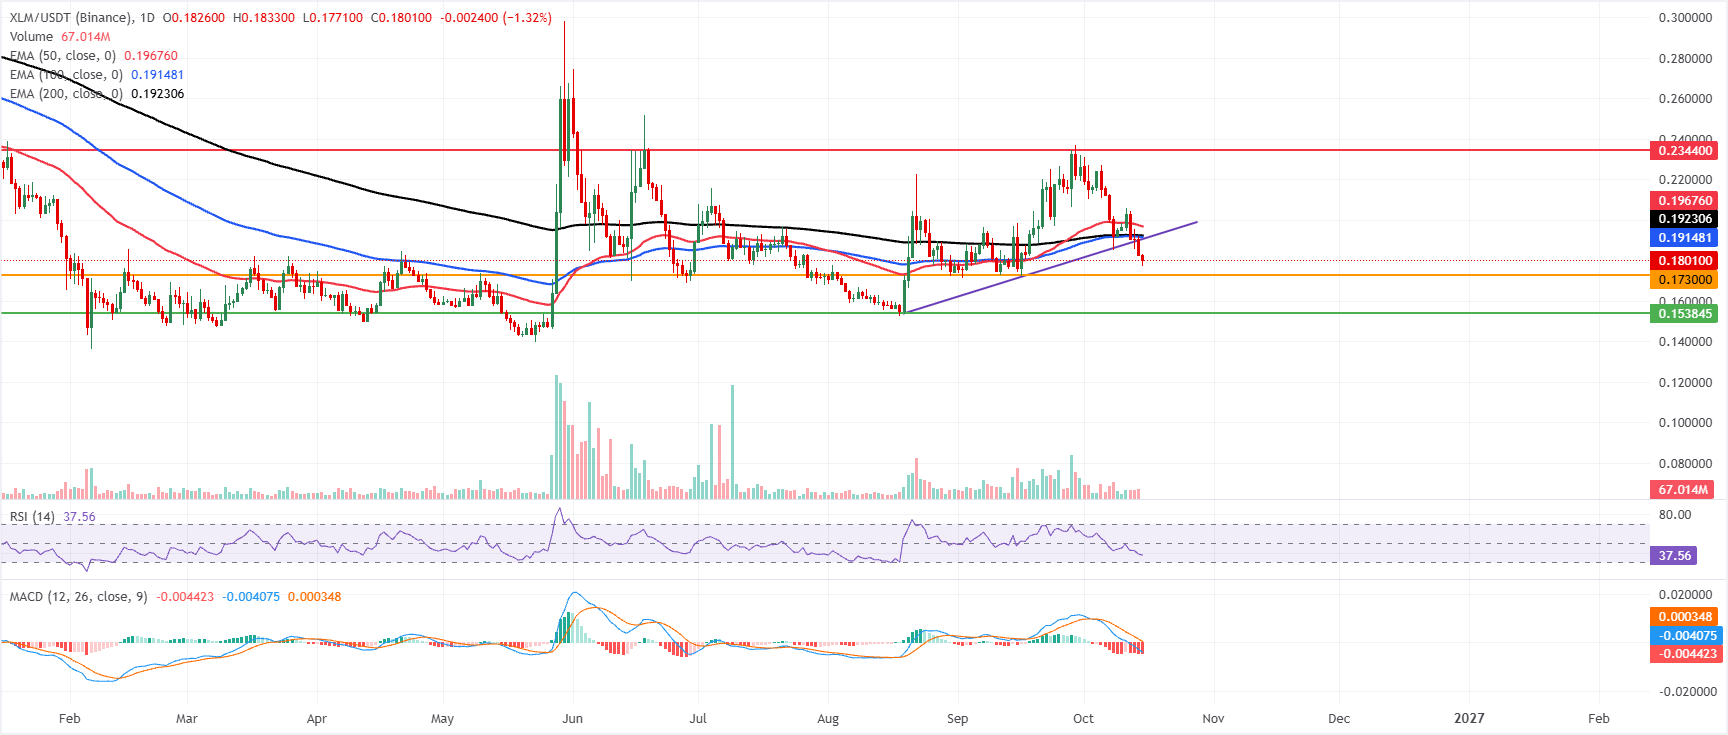
- XLM extends losses, trading below $0.181, after closing below the ascending trendline the previous day.
- Hotter-than-expected US CPI data, bearish derivatives metrics and weakening technical structures suggest further downside risks.

Ripple (XRP) and Stellar (XLM) extend their losses on Thursday as bearish momentum builds, having corrected over 7% and 11% so far this week. XRP and XLM both slip below key support zones, indicating weakening technical structure. Moreover, rising expectations of a Federal Reserve (Fed) rate hike after hotter-than-expected US Consumer Price Index (CPI) data on Wednesday add further headwinds for both altcoins.
Hotter US CPI weighs on Ripple and Stellar
The US annual inflation rate was 3.7% in September, as measured by the CPI on Wednesday, up from August’s 3.4% increase. Moreover, the core CPI, excluding fluctuating food and energy costs, increased by 2.6% in the same month, up from August’s 2.4% rise. Meanwhile, the monthly CPI and core CPI also rose by 0.6% and 0.3%, respectively.
These hotter-than-expected US CPI data pointed to broadening inflation pressures, reaffirming bets for further policy tightening by the Federal Reserve (Fed).
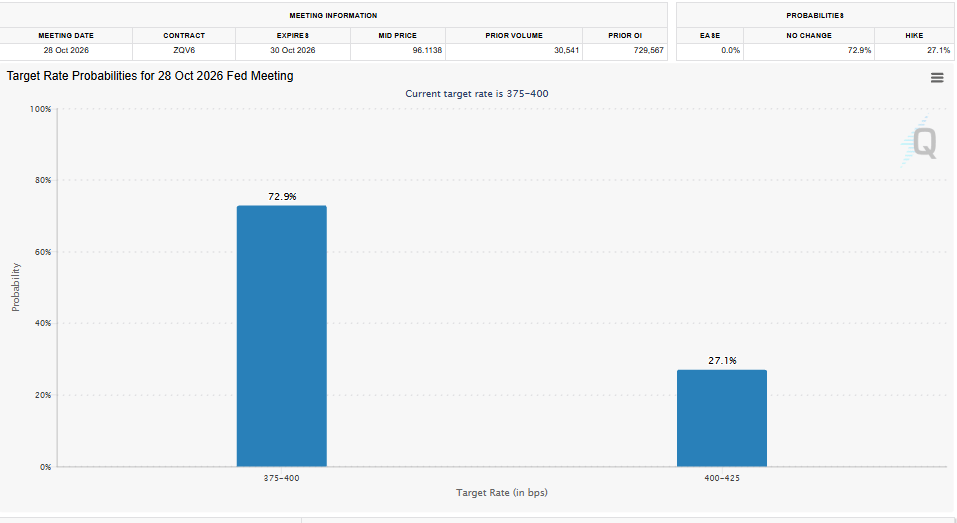
According to the CME FedWatch Tool, traders are pricing in a 27% probability of a 25-basis-point (bps) rate hike at the October policy meeting, up from 17% last Friday.
Rising expectations of tighter monetary policy are pressuring risk-sensitive assets, with BTC falling below $81,000 on Thursday and also weighing on Ripple and Stellar.
Market participants now look forward to the release of the US Producer Price Index (PPI) on Thursday. In addition, Fed Chair Kevin Warsh’s speech on Friday will be watched for more cues on the future policy path, which will play a key role in near-term US Dollar (USD) price dynamics and provide meaningful impetus to risky assets such as cryptos.
Derivatives metrics show bearish bias
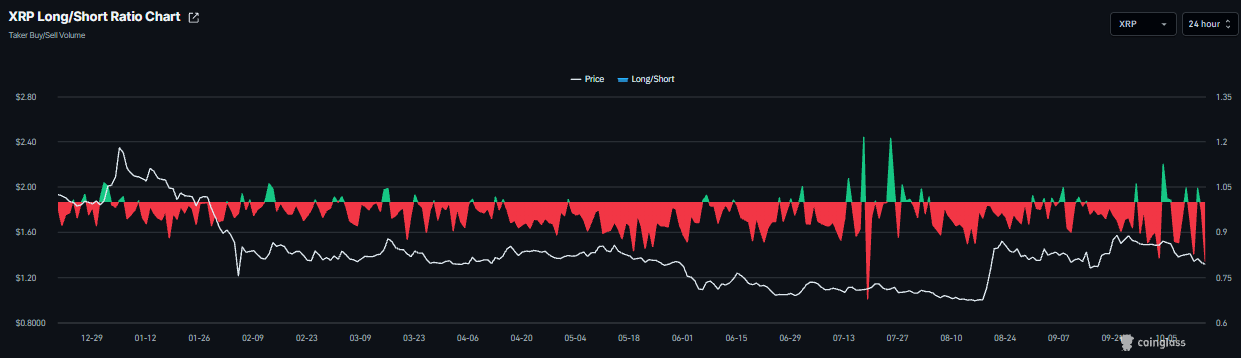
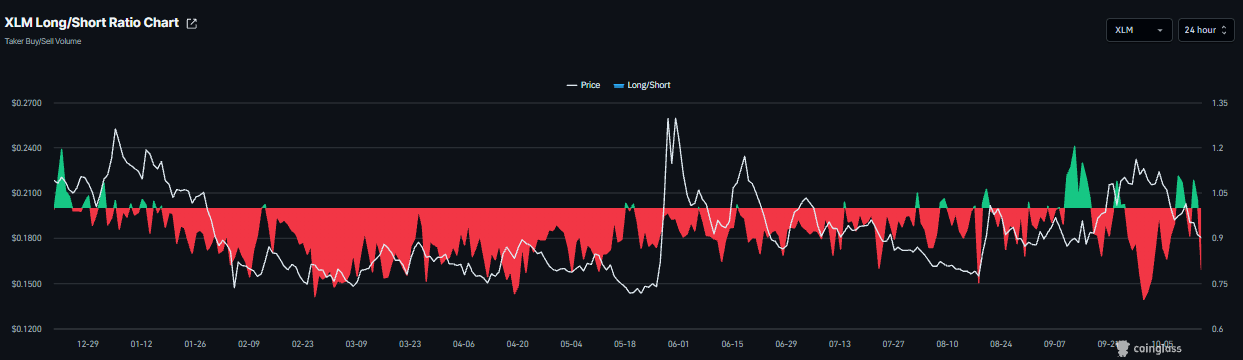
Derivatives data shows weakening conditions for Ripple and Stellar. CoinGlass’ long-to-short ratios for XRP and XLM read 0.80 and 0.79, respectively, on Thursday, nearing the lowest level over a month. A ratio below one indicates bearish sentiment, as traders bet that asset prices will fall.
XRP technical outlook: Slips below EMA support
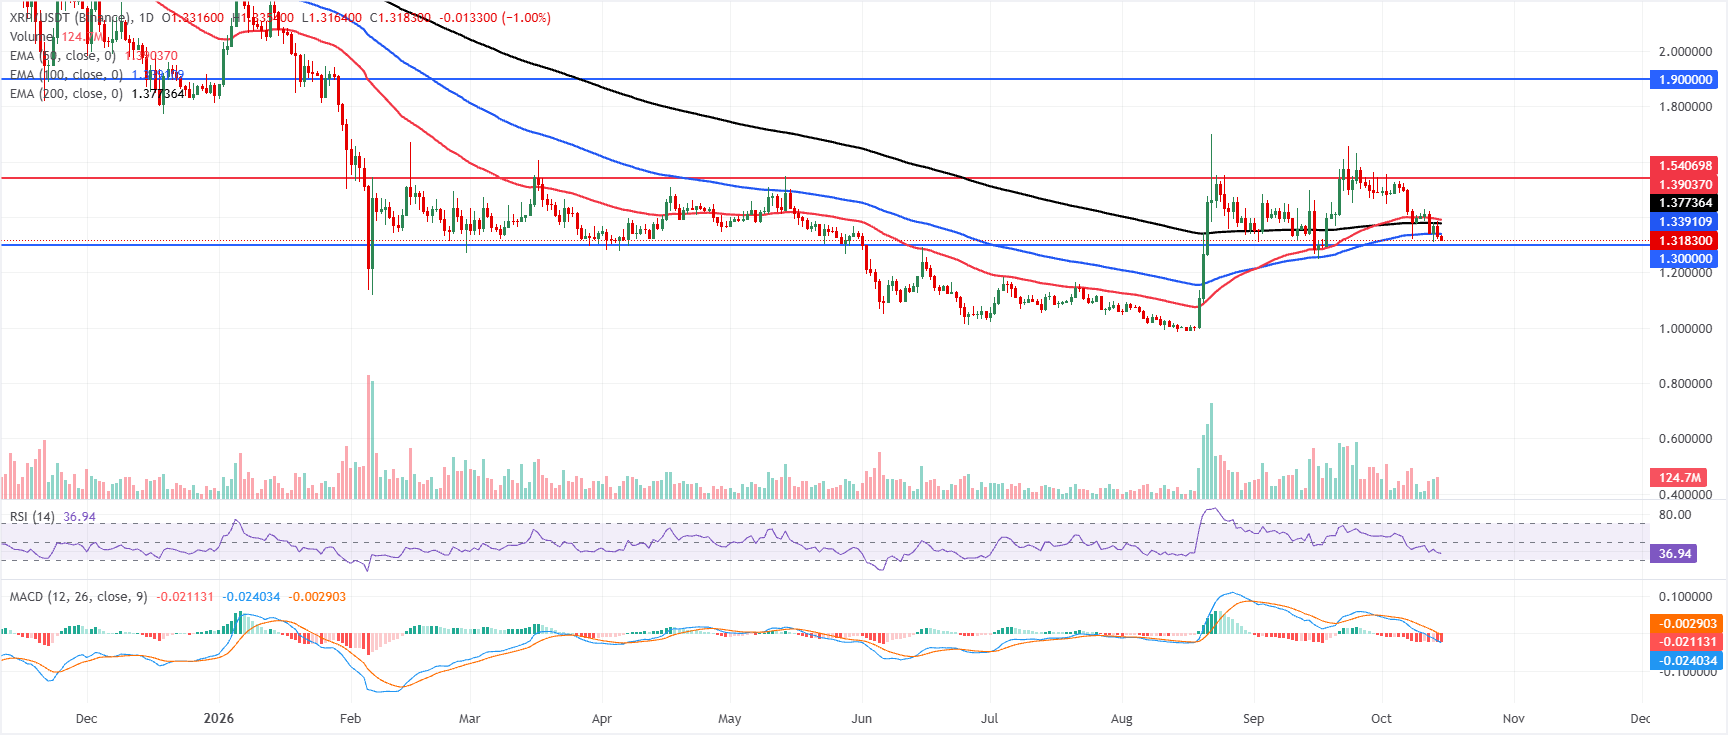
XRP price trades at $1.318 on Thursday, extending a corrective phase under key Exponential Moving Averages (EMAs) and maintaining a bearish near-term tone. Price holds below the 100-day EMA at $1.339 and the 200-day EMA at $1.377, with the 50-day EMA remaining higher at $1.390, suggesting rallies remain capped by a dense overhead cluster.
The Relative Strength Index (RSI) around 36 leans toward oversold territory, while the Moving Average Convergence Divergence (MACD) stays negative, both reinforcing persistent downward pressure rather than signaling a clear reversal.
On the topside, initial resistance appears at the 100-day EMA near $1.339, followed by the 200-day EMA at $1.377 and the 50-day EMA at $1.390, where sellers could reassert control. Higher up, a horizontal barrier is seen at $1.540, ahead of the more distant resistance line near $1.900.
On the downside, immediate support is aligned with the horizontal level at $1.300; a decisive break beneath this floor would expose deeper losses, while holding above it may allow XRP to consolidate before any attempt to challenge the overhead EMAs.
XLM technical outlook: Weakening momentum indicators
XLM price trades at $0.180 on Thursday, maintaining a bearish near‑term bias as it holds below key EMAs. The 100‑day EMA at $0.191, the 200‑day EMA at $0.192 and the 50‑day EMA at $0.196 all stack overhead, reinforcing a capped structure after the break of the rising trendline, whose breach point near $0.190 now acts as resistance.
Momentum is weak, with the RSI around 37 and the MACD line below its signal and below the zero line, suggesting persistent downside pressure despite recent stabilization.
On the topside, initial resistance is seen at the former trendline break area around $0.190, followed by the 100‑day EMA at $0.191 and the 200‑day EMA at $0.192, while the 50‑day EMA at $0.196 protects the path toward the horizontal barrier at $0.234.
On the downside, the immediate focus is on the recent close area at $0.180, with further support at $0.173 and then the broader structural floor at $0.153, where buyers would be expected to show more interest if the sell‑off extends.
(The technical analysis of this story was written with the help of an AI tool. Know more.)
Author

Manish Chhetri
FXStreet
Manish Chhetri is a crypto specialist with over four years of experience in the cryptocurrency industry.




