|

XRP Price Analysis: XRP/USD bulls must break above $0.1900

  • XRP price is trading in positive territory, with gains of some 1.70% on Thursday.
  • XRP/USD attempting to rebuild on the gains seen in the session on Wednesday. 
  • Critical downside support should be noted at the $0.1800 mark, resistance at $0.1900. 
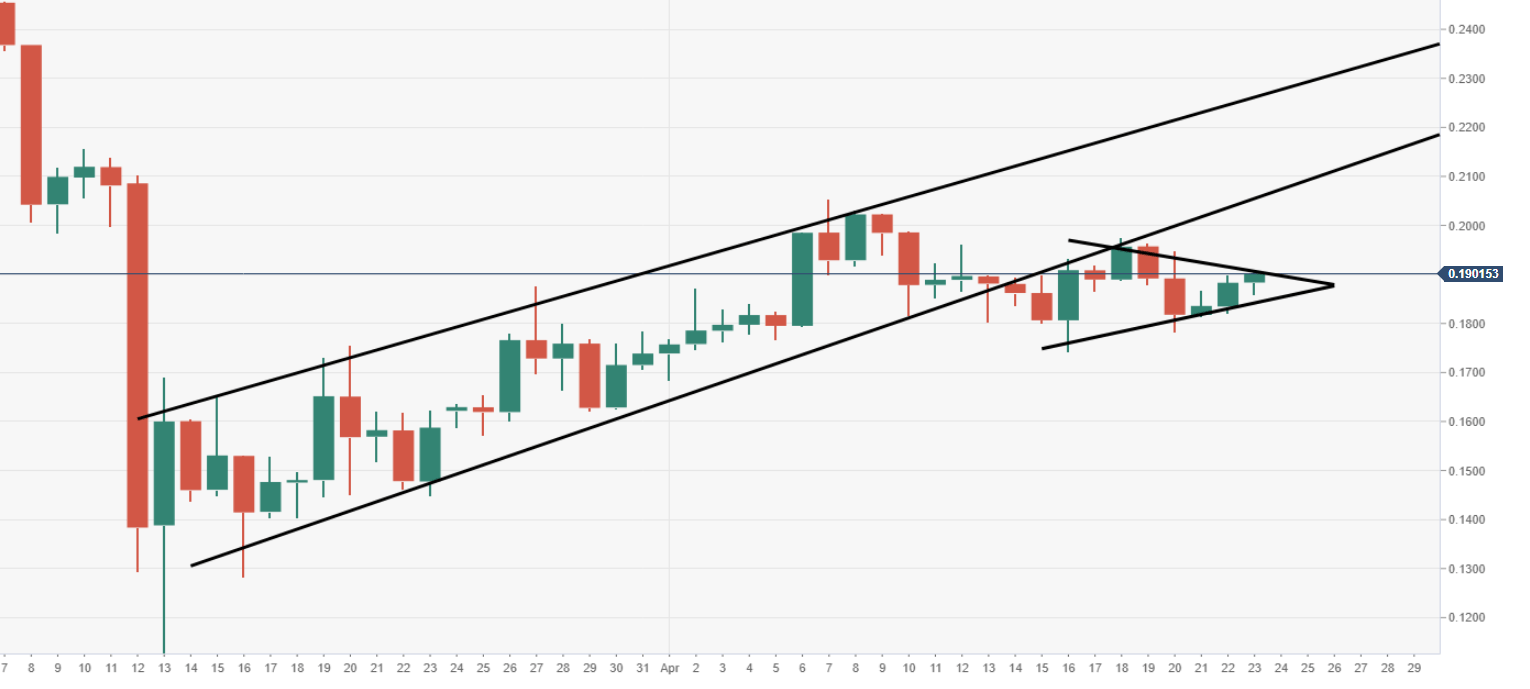
XRP/USD daily chart

A tight range remains the case via the daily chart view, moving between $0.1800-0.2000. 

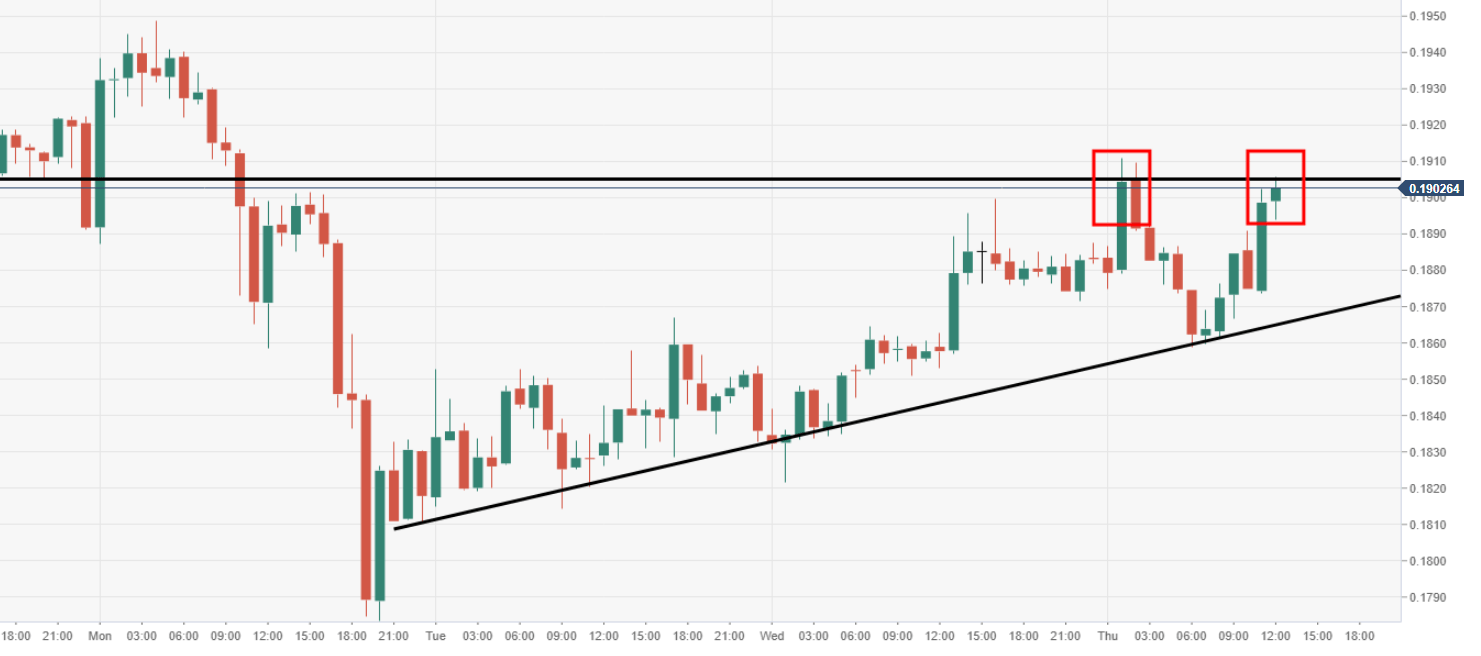
XRP/USD 60-minute chart

There is a risk of a near-term double top via the 60-minute chart view. The $0.1900 level is the top area. 


Spot rate:                   0.1901

Relative change:       +1.00%

High:                          0.1910

Low:                           0.1858

Author

Ken Chigbo

Ken Chigbo

Independent Analyst

Ken has over 8 years exposure to the financial markets. He started his career as an analyst, covering a variety of asset classes; forex, fixed income, commodities and equities.

More from Ken Chigbo
Share:

Editor's Picks

Crypto's future lies in tokenized real-world assets, not speculation

Atlas Capital CEO Reza Bandi stated that the crypto industry's next major growth phase will be driven by the tokenization of real-world assets rather than speculative trading. In an interview with FXStreet, Bandi identified three factors supporting the expansion of tokenization.

Top 3 Price Prediction: BTC remains vulnerable, ETH weakens further, XRP signals more downside

Bitcoin, Ethereum, and Ripple remain under pressure mid-week, as the broader cryptocurrency market struggles to regain recovery momentum. BTC struggles below $62,000, ETH continues to weaken below $1,650, while XRP’s momentum indicators remain biased toward further downside.

Crypto Overview: Bitcoin is back under $62,000 – Hyperliquid, DeXe lead losses

The broader cryptocurrency market is under pressure with Bitcoin slipping below $62,000 amid the US launching its third wave of strikes on Iran. Hyperliquid and DeXe are leading losses over the last 24 hours, risking the prevailing upward trend.

Bitcoin sell-off pushes over 50% of circulating supply into loss, hinting at market bottom
Bitcoin (BTC) dropped near $61,000 on Tuesday, with the latest sell-off pushing long-term market indicators toward levels historically associated with bear-market bottoms, according to a report by K33 Research.
Bitcoin: After the bloodbath, everyone looks at $60,000
Bitcoin (BTC) hovers above $62,000 at the time of writing on Friday, weighed down by growing risk-off sentiment due to persistent geopolitical tensions in the Middle East and sticky macroeconomic uncertainty. The institutional sell-off continued to wreak havoc on capital flows, with spot Bitcoin Exchange-Traded Funds (ETFs) recording billions in outflows.