XLM Price Forecast: XLM awaits imminent 23% move
- XLM price is contained inside a descending triangle pattern on the 1-hour chart.
- The digital asset trades between two key levels that will determine its future.
- A massive bearish divergence has formed for XLM on the 3-day chart.

Stellar is trading at $0.50 at the time of writing between two key levels that will be critical for its short-term future.
XLM price shows different signs to investors
On the 1-hour chart, XLM price has formed a descending triangle pattern with its resistance trend line at $0.526 and its support at $0.473. The pattern can be drawn by connecting the lower highs with a trend line and the similar lows with a parallel line, both converging at the same point.
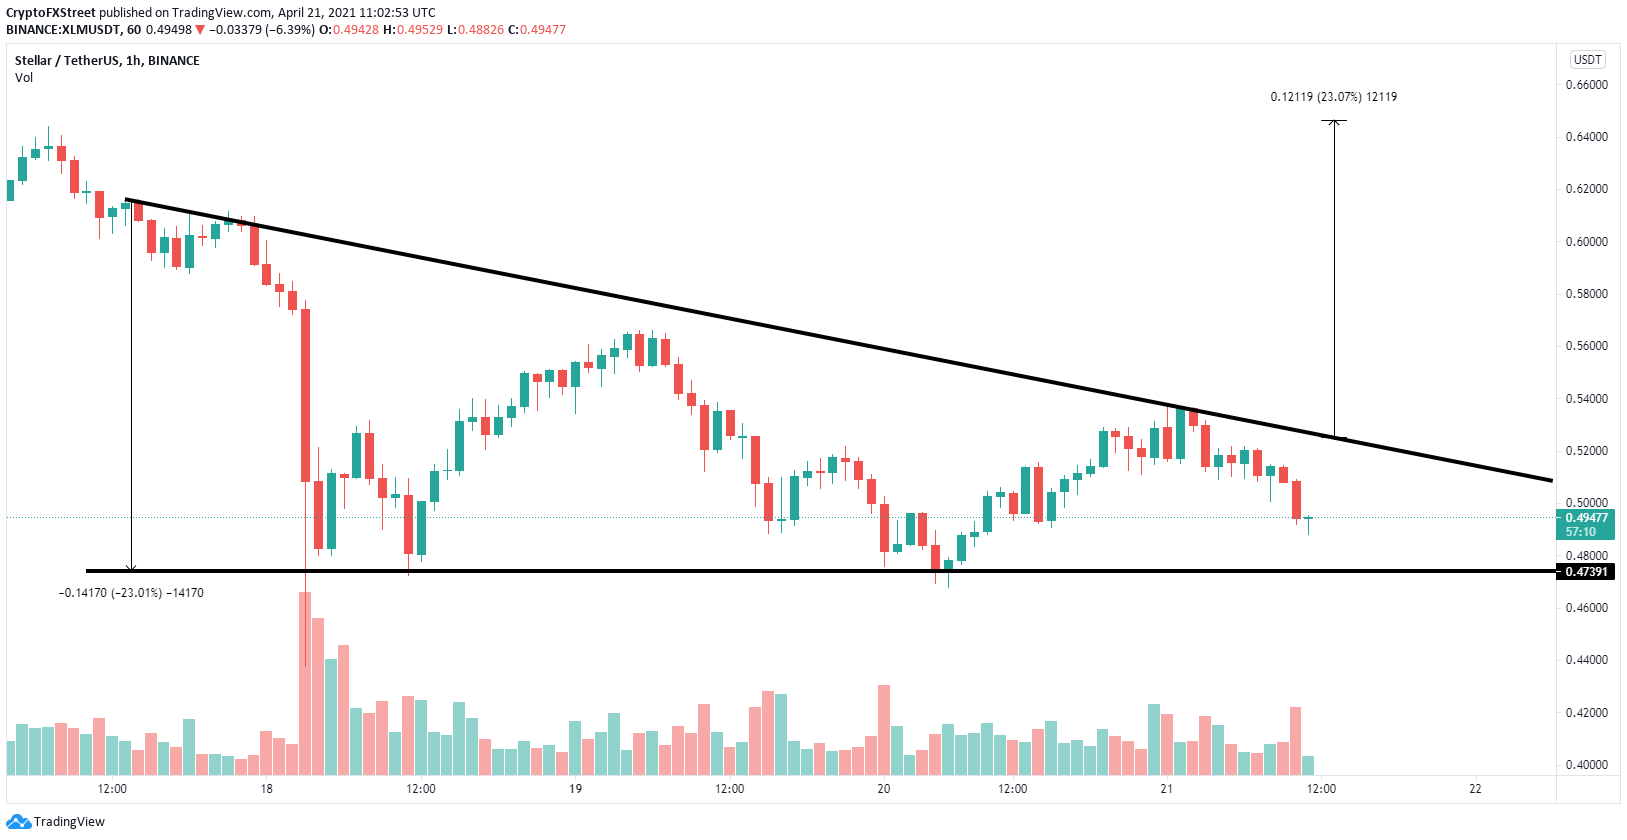
XLM/USD 1-hour chart
A 1-hour candlestick close above the upper boundary has a 23% price target, calculated using the initial height of the pattern. XLM price could quickly jump to $0.565, $0.62, and eventually $0.646.
However, on the 3-day chart, the Relative Strength Index (RSI) and the price have formed a significant bearish divergence as XLM price has posted higher highs while the RSI established lower highs.
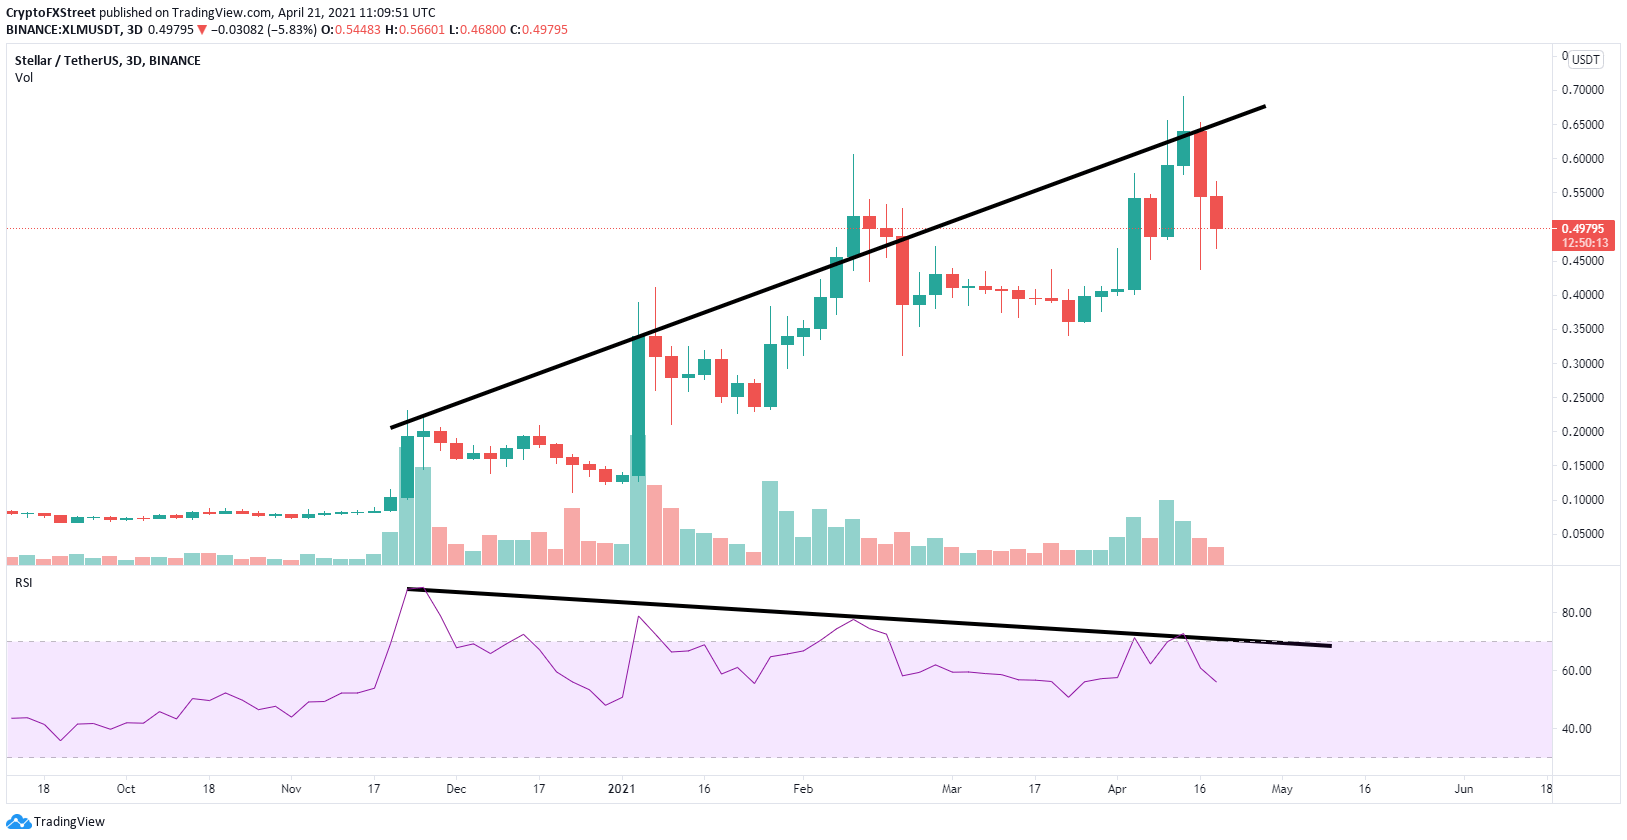
XLM/USD 3-day chart
This bearish divergence is significant and favors the bears. A 1-hour candlestick close below the key support level at $0.472 will confirm a breakdown.
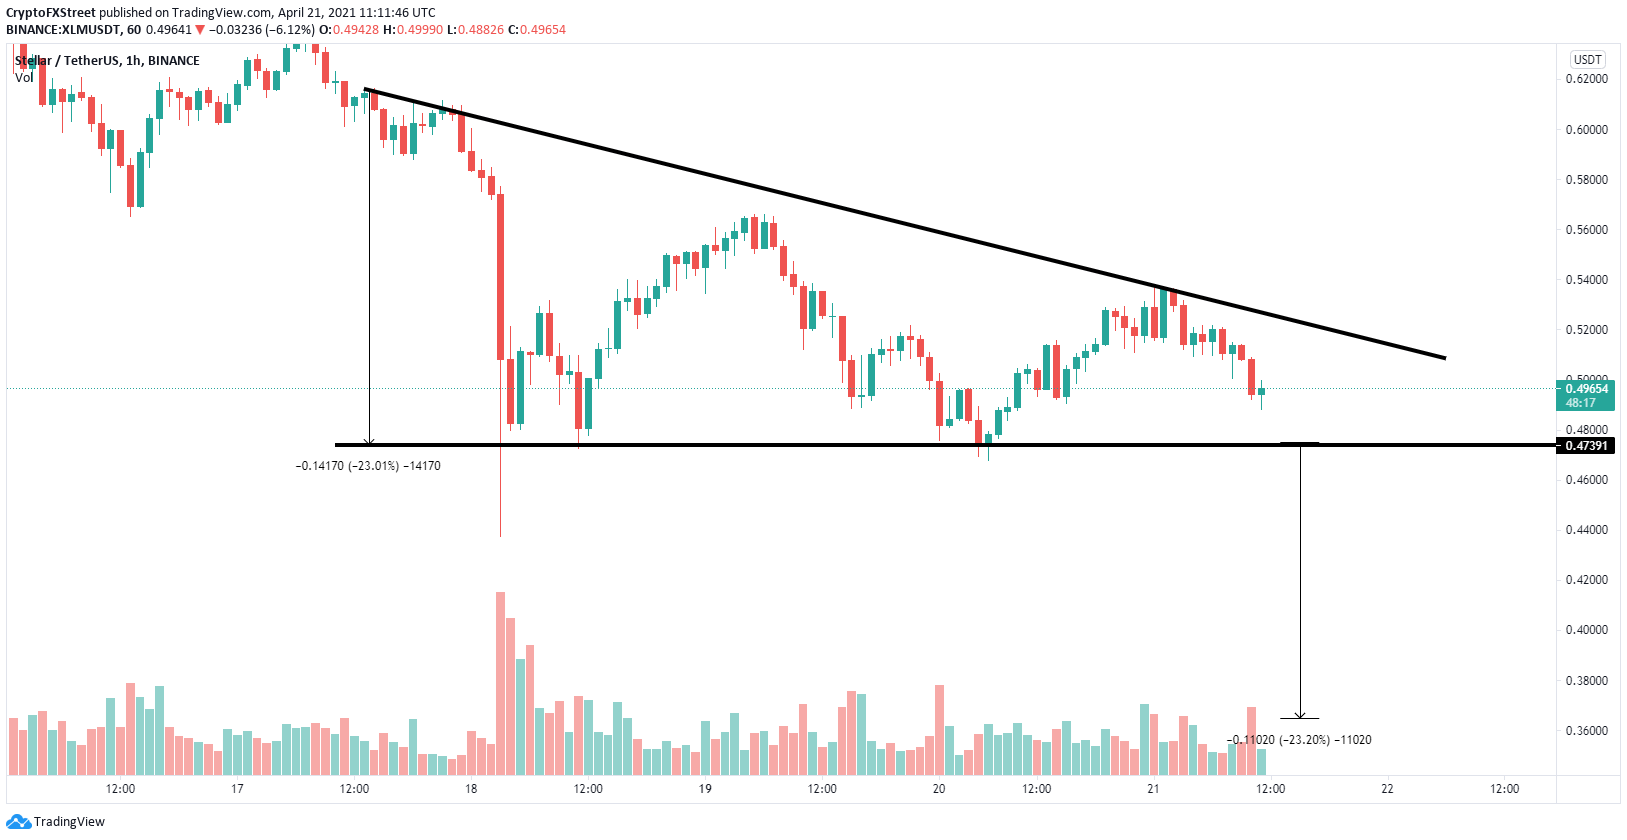
XLM/USD 1-hour chart
The breakdown of the descending triangle pattern has a price target of $0.366, which is also a 23% move.
Author

Lorenzo Stroe
Independent Analyst
Lorenzo is an experienced Technical Analyst and Content Writer who has been working in the cryptocurrency industry since 2012. He also has a passion for trading.


