Why Dogecoin-killer Shiba Inu may return to $0.00001
- Shiba Inu price has maintained most of its gains from last week's flash crash lows.
- SHIBA's congestion creates opportunities for the long and short sides of the market.
- Upside potential is the most unlikely direction as downside risks remain a concern.

Shiba Inu price continues to consolidate after last week's flash crash. However, despite a flurry of activity across the cryptocurrency market, SHIBA has not seen any marked difference in volume participation – a possible warning signal for bulls.
Shiba Inu price is likely to retest the $0.000016 value area – but a move further south is more probable
Shiba Inu price action, from the perspective of the Ichimoku Kinko Hyo system, is decidedly bearish. On its 3-week, weekly, and daily charts, SHIBA is below all of the Ichimoku indicators. However, a mean reversion higher is very likely because of how swiftly and dramatically SHIBA moved last week.
An extremely important time cycle within the Ichimoku system may trigger a big move for Shiba Inu price. There is a Kumo Twist present today on the daily chart. Kumo Twists are occurrences when Senkou span A crosses Senkou Span B – visually, this is identified when the Cloud changes color from red to green or green to red.
Kumo Twists can often give traders and analysts a 'heads up to where an important swing high or low may develop – especially if the instrument was trending strongly into when the Kumo Twist occurs. For Shiba Inu price, this means that SHIBA could see a dramatic drive higher to cover the large gap between the Kijun-Sen and the bodies of the daily candlesticks - but probably not until SHIBA hits new lower lows.
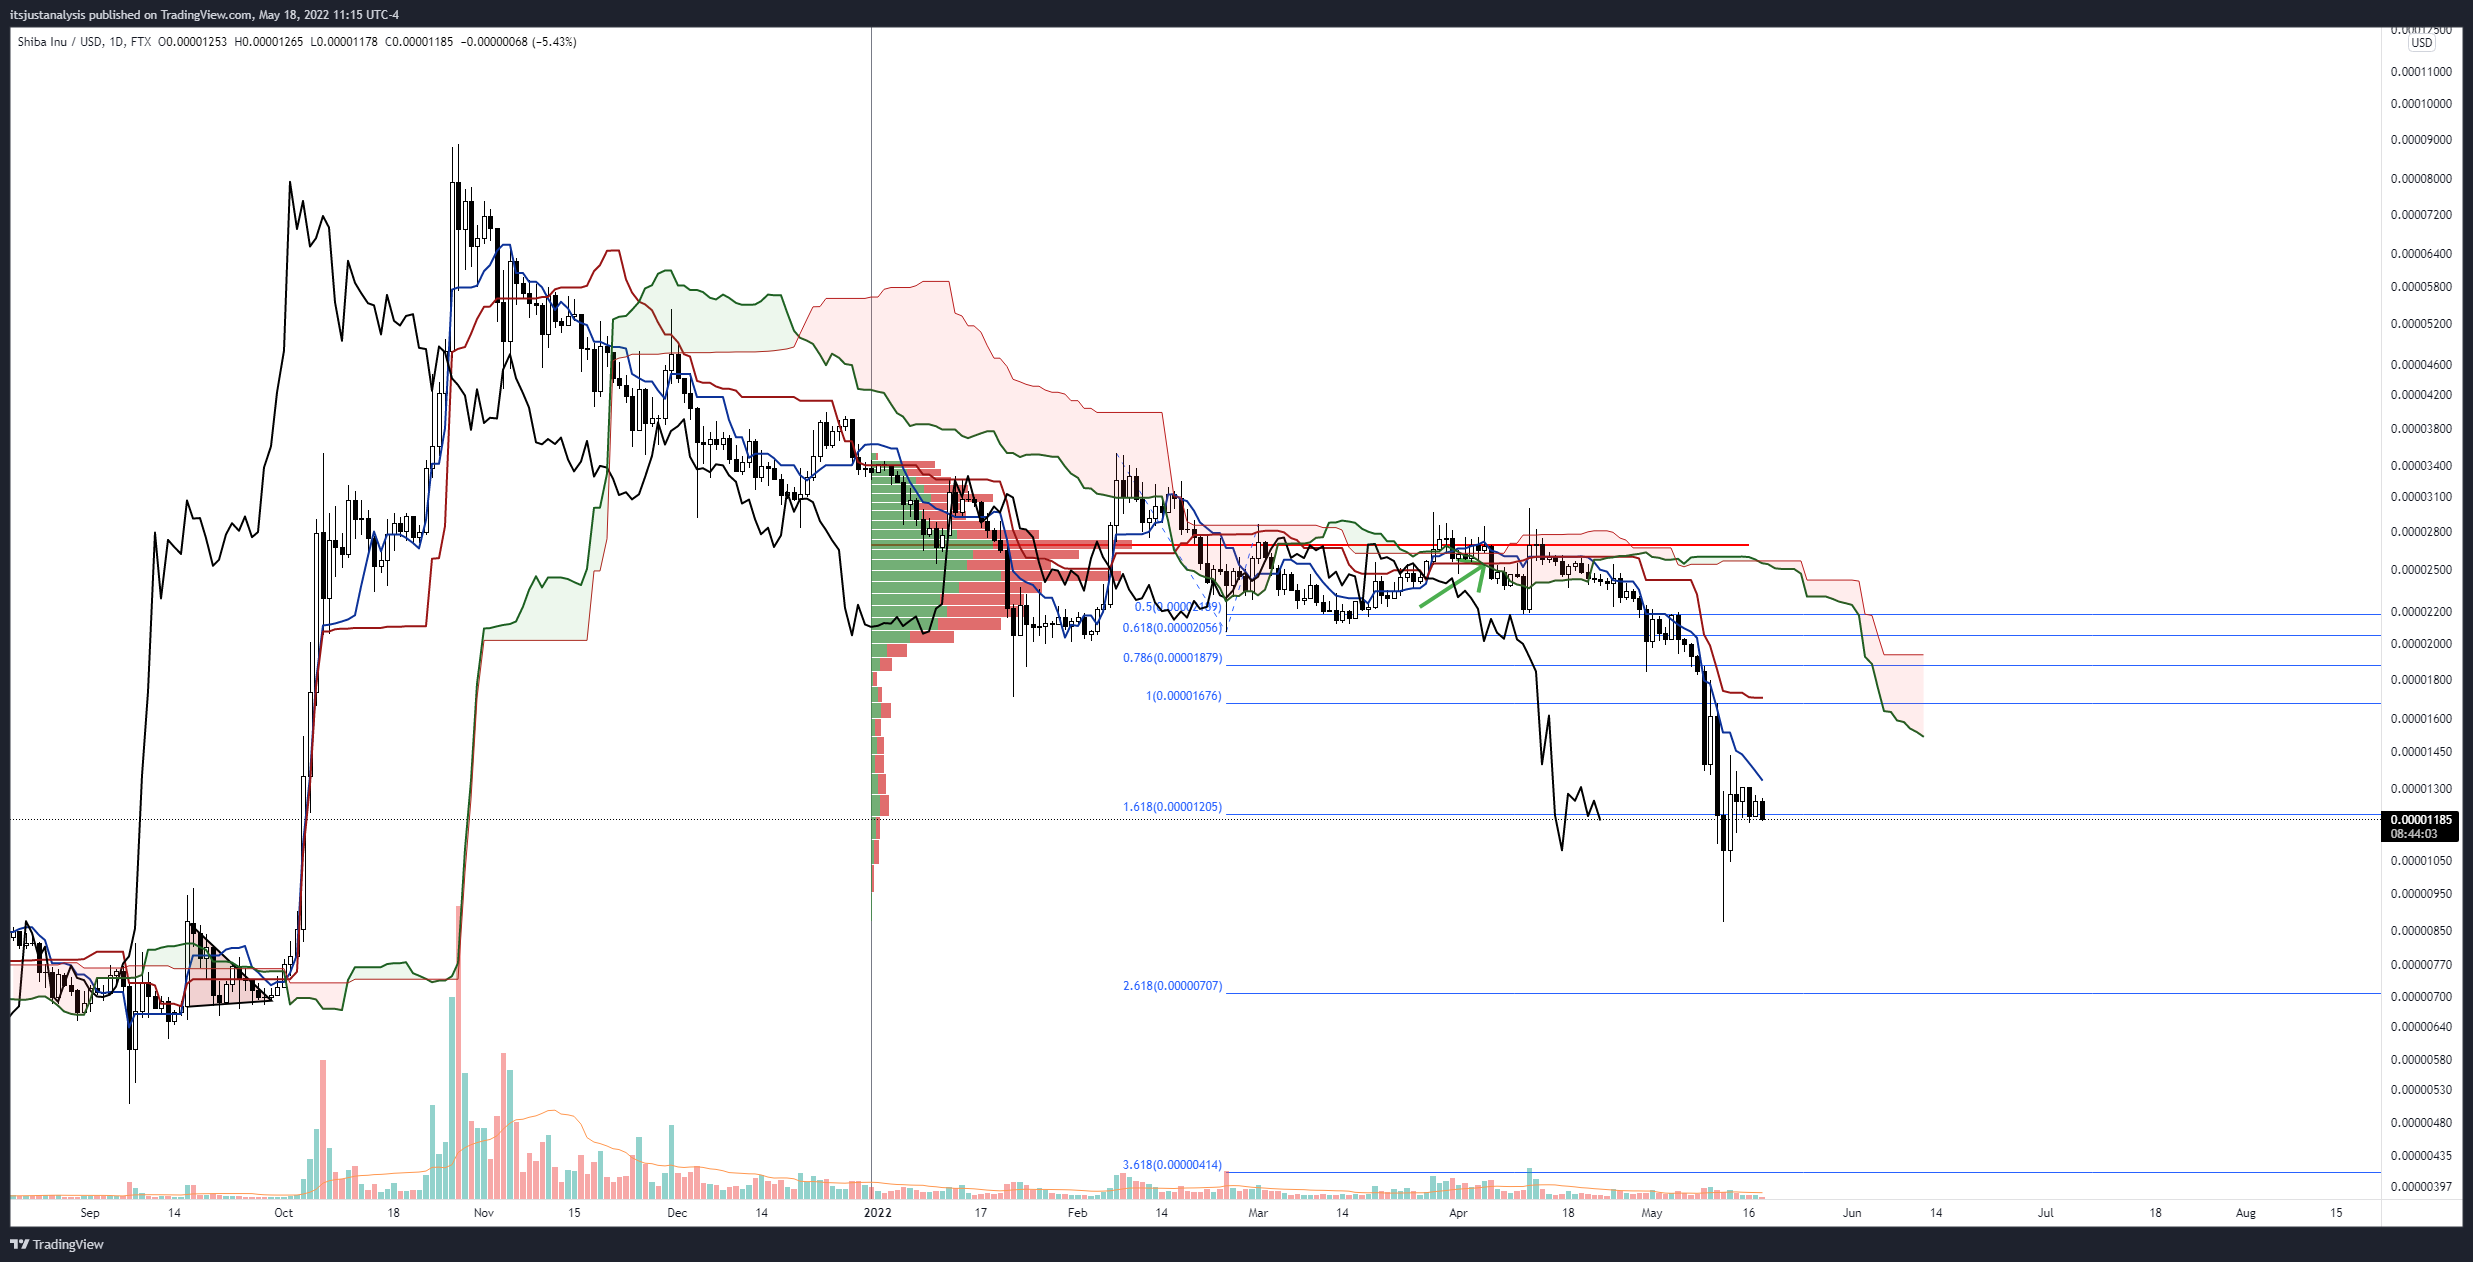
SHIBA/USDT Daily Ichimoku Kinko Hyo Chart
Upside potential for Shiba Inu price in the event of any bullish momentum will likely be capped near the $0.000016 value area where the 100% Fibonacci expansion and daily Kijun-Sen currently exist.
Downs risks for SHIBA remain the most likely direction due to its position within the Ichimoku system but may be limited to the $0.000010 range.
Author

Jonathan Morgan
Independent Analyst
Jonathan has been working as an Independent future, forex, and cryptocurrency trader and analyst for 8 years. He also has been writing for the past 5 years.



