Top Crypto Gainers: DeXe, Hyperliquid, and Zcash rally as Bitcoin stabilizes above $70,000
- DeXe rises 9% so far on Tuesday, testing its 200-day EMA near $5.
- Hyperliquid faces headwinds near $35 on Tuesday after a 13% rise the previous day.
- Zcash extends gains after an 8% rebound from a crucial support level on Monday.

DeXe (DEXE), Hyperliquid (HYPE), and Zcash (ZEC) are leading the gains over the last 24 hours. US President Donald Trump's statement hinting at the end of the 10-day-old war with Iran eased downside pressure on Monday, lifting Bitcoin (BTC) and other top altcoins.
Bitcoin and Ethereum (ETH) hold above $70,000 and $2,000, respectively, at press time on Tuesday, while the technical outlook of DEXE, HYPE, and ZEC focuses on key overhead resistance levels.
Will Bitcoin rebound to $73,000 if the US-Iran war ends?
Donald Trump hinted that the ongoing war with Iran could be coming to an end in a press meeting on Monday. Trump said, “I think the war is very complete, pretty much. They have no navy, no communications, they’ve got no Air Force."
However, the narrative is now gradually shifting back to the Iranian oil control. Trump dodged making any comments on seizing Iran’s oil and said it is too soon to talk about it.
Still, the news provided tailwinds to the US stock market, allowing it to recover the gap down on Monday by the second half of the trading session.
Bitcoin extends gains above $70,000 at the time of writing on Tuesday, building on Monday's 3% rise. The recovery crosses above the 78.6% trend-based Fibonacci retracement level at $68,839, measured between the October 6 high of $126,199, November 21 low of $80,600, and the January 14 high of $97,924.
A decisive close above this level could set up further recovery for Bitcoin toward the 50-day Exponential Moving Average (EMA) at $73,136.
The Moving Average Convergence Divergence (MACD) inches closer to the zero line as it rises within the negative territory and histograms expand above it, suggesting persisting bullish momentum. Meanwhile, the Relative Strength Index (RSI) rebounds to the 50 midline as selling pressure wanes, shifting the trend neutral.
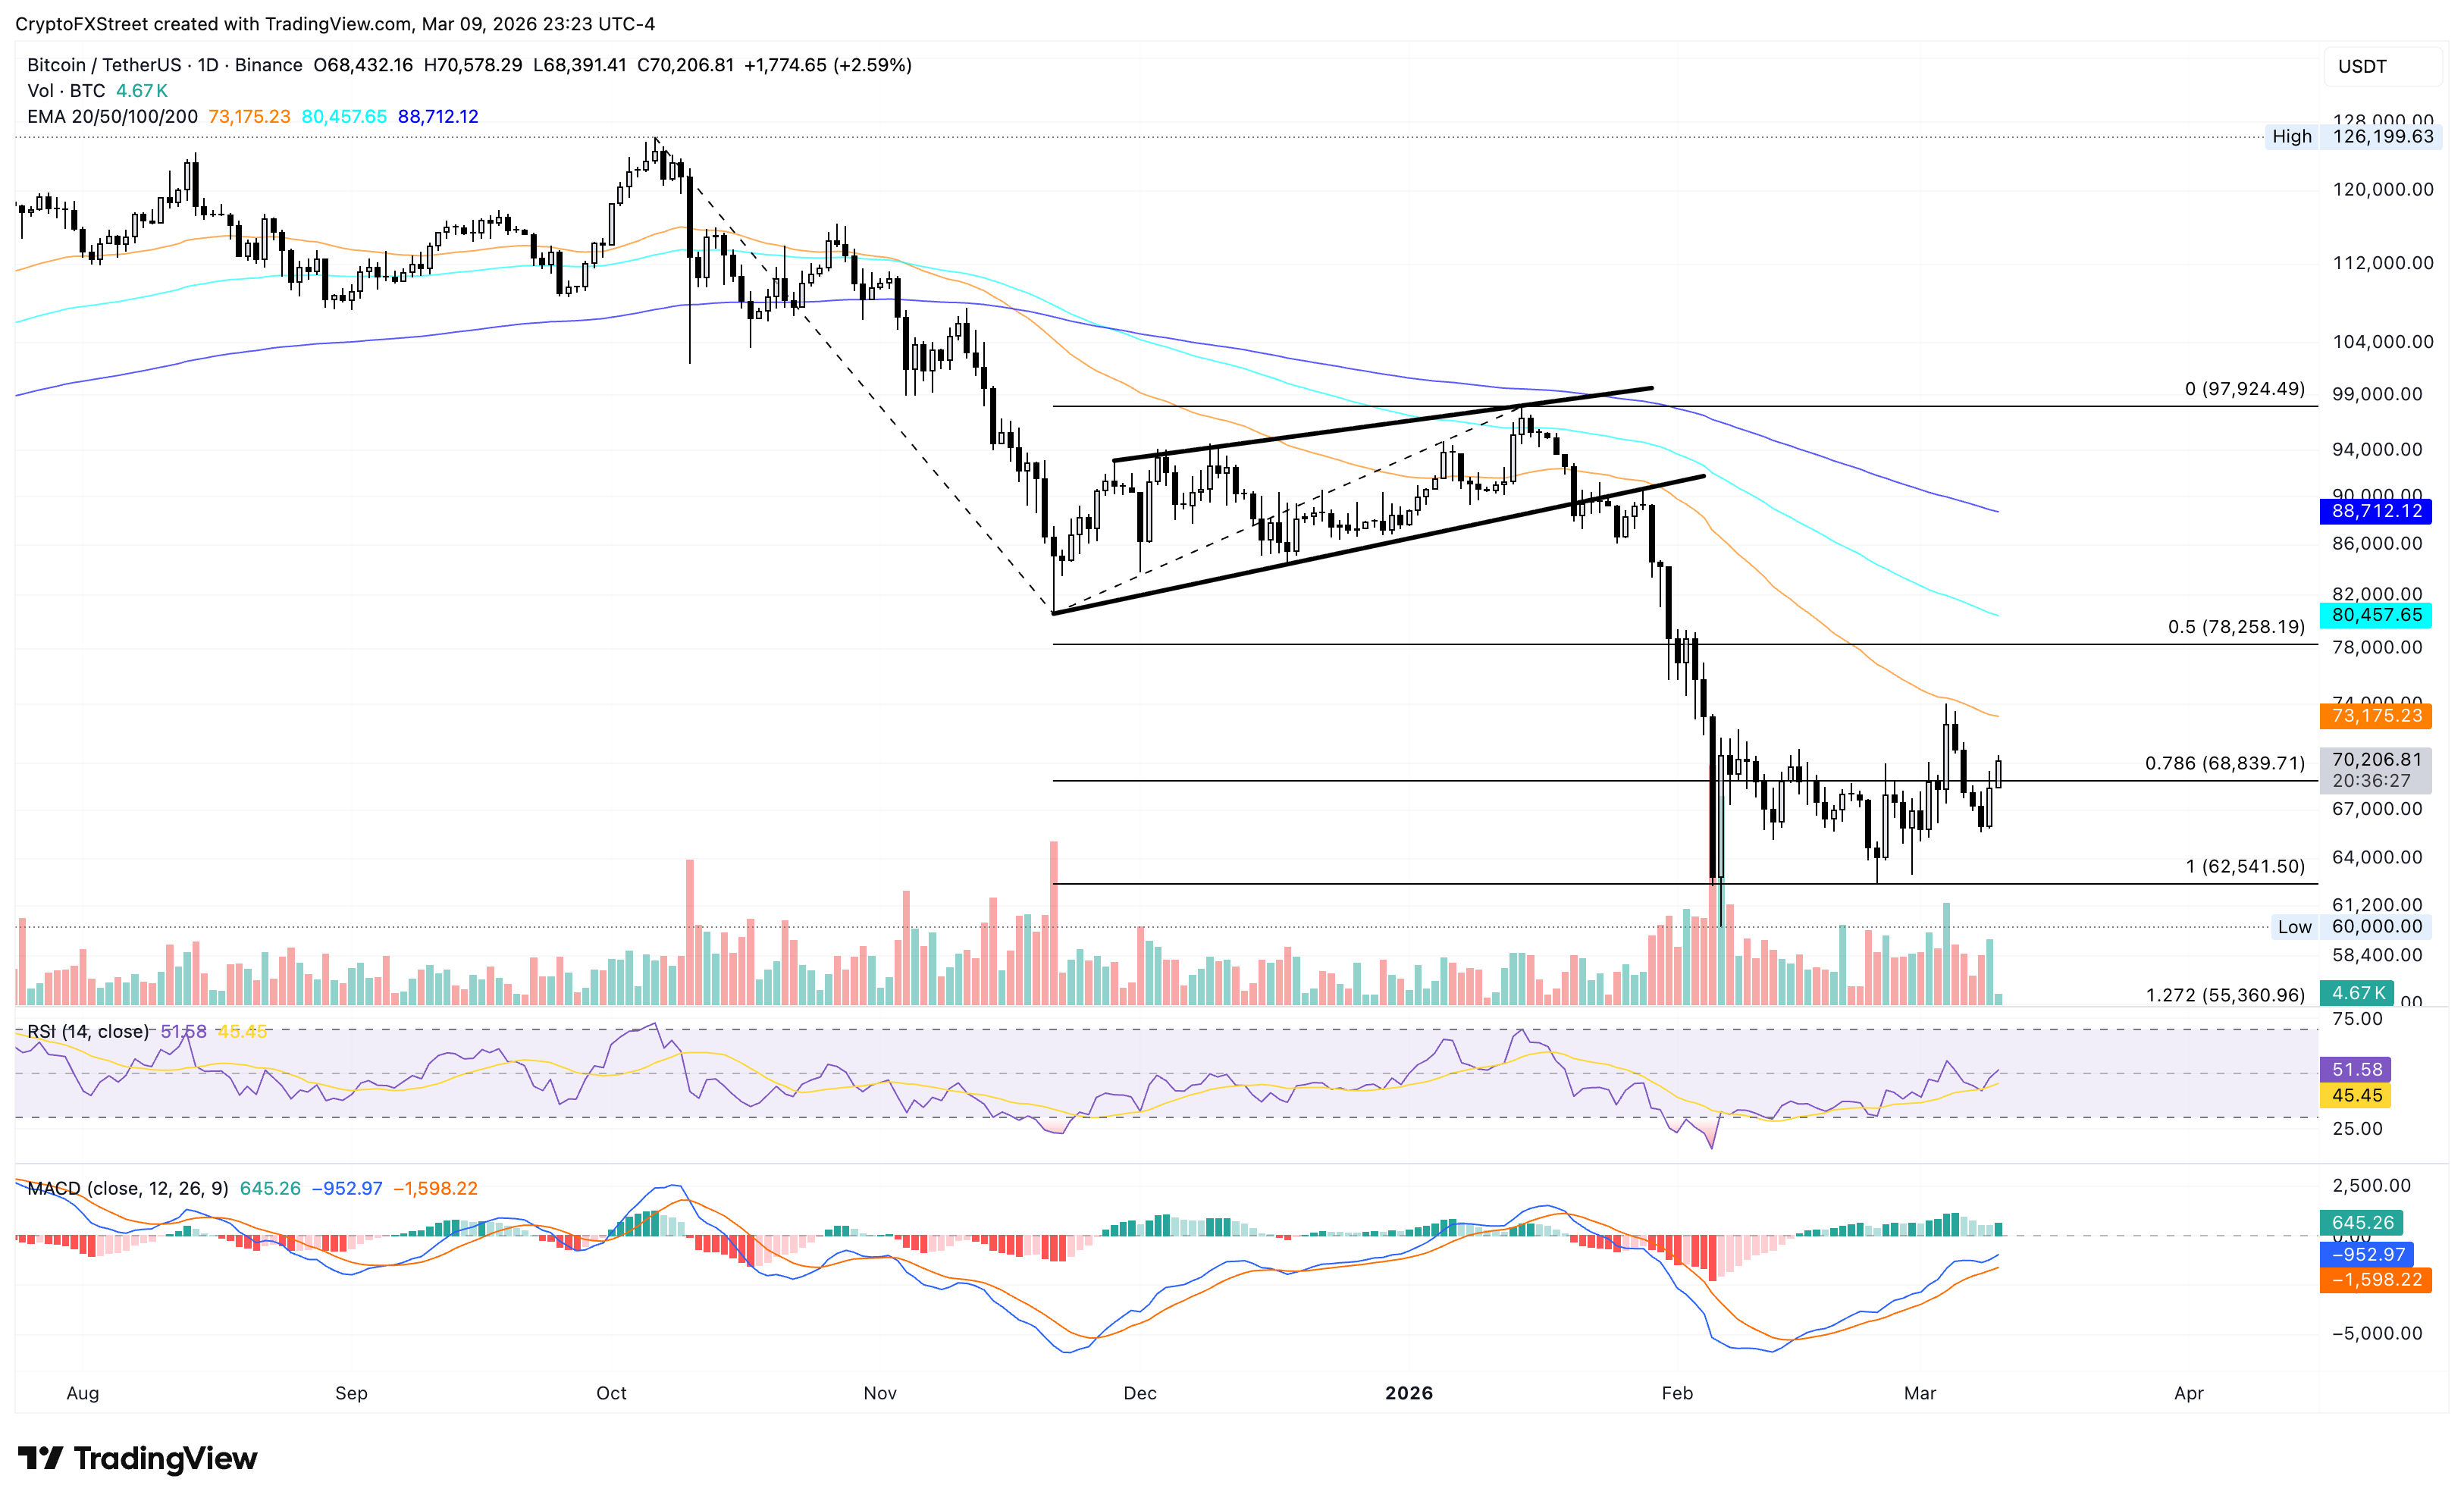
Looking down, a daily close below $68,839 could reaffirm the downside pressure, risking a decline to the $62,541 base support.
DeXe extends rally above $5
DeXe is up 9% at press time on Tuesday, crossing above the $5.00 mark after an 18% surge the previous day. The altcoin extends its recovery for the third consecutive day, testing its 200-day EMA at $5.03. The near-term bias is bullish, as the short-term recovery drives an upward slope in the 50- and 100-day EMAs.
A decisive close above the 200-day EMA could pave an upward path to the 78.6% Fibonacci retracement at $6.36, measured from the November 1 high at $7.63 to the February 6 low at $1.73.
The MACD rises above its signal line and remains in positive territory, with the histogram expanding, suggesting firm upside momentum. The RSI at 80 signals overbought conditions, though it still reflects strong buying pressure rather than a confirmed reversal.
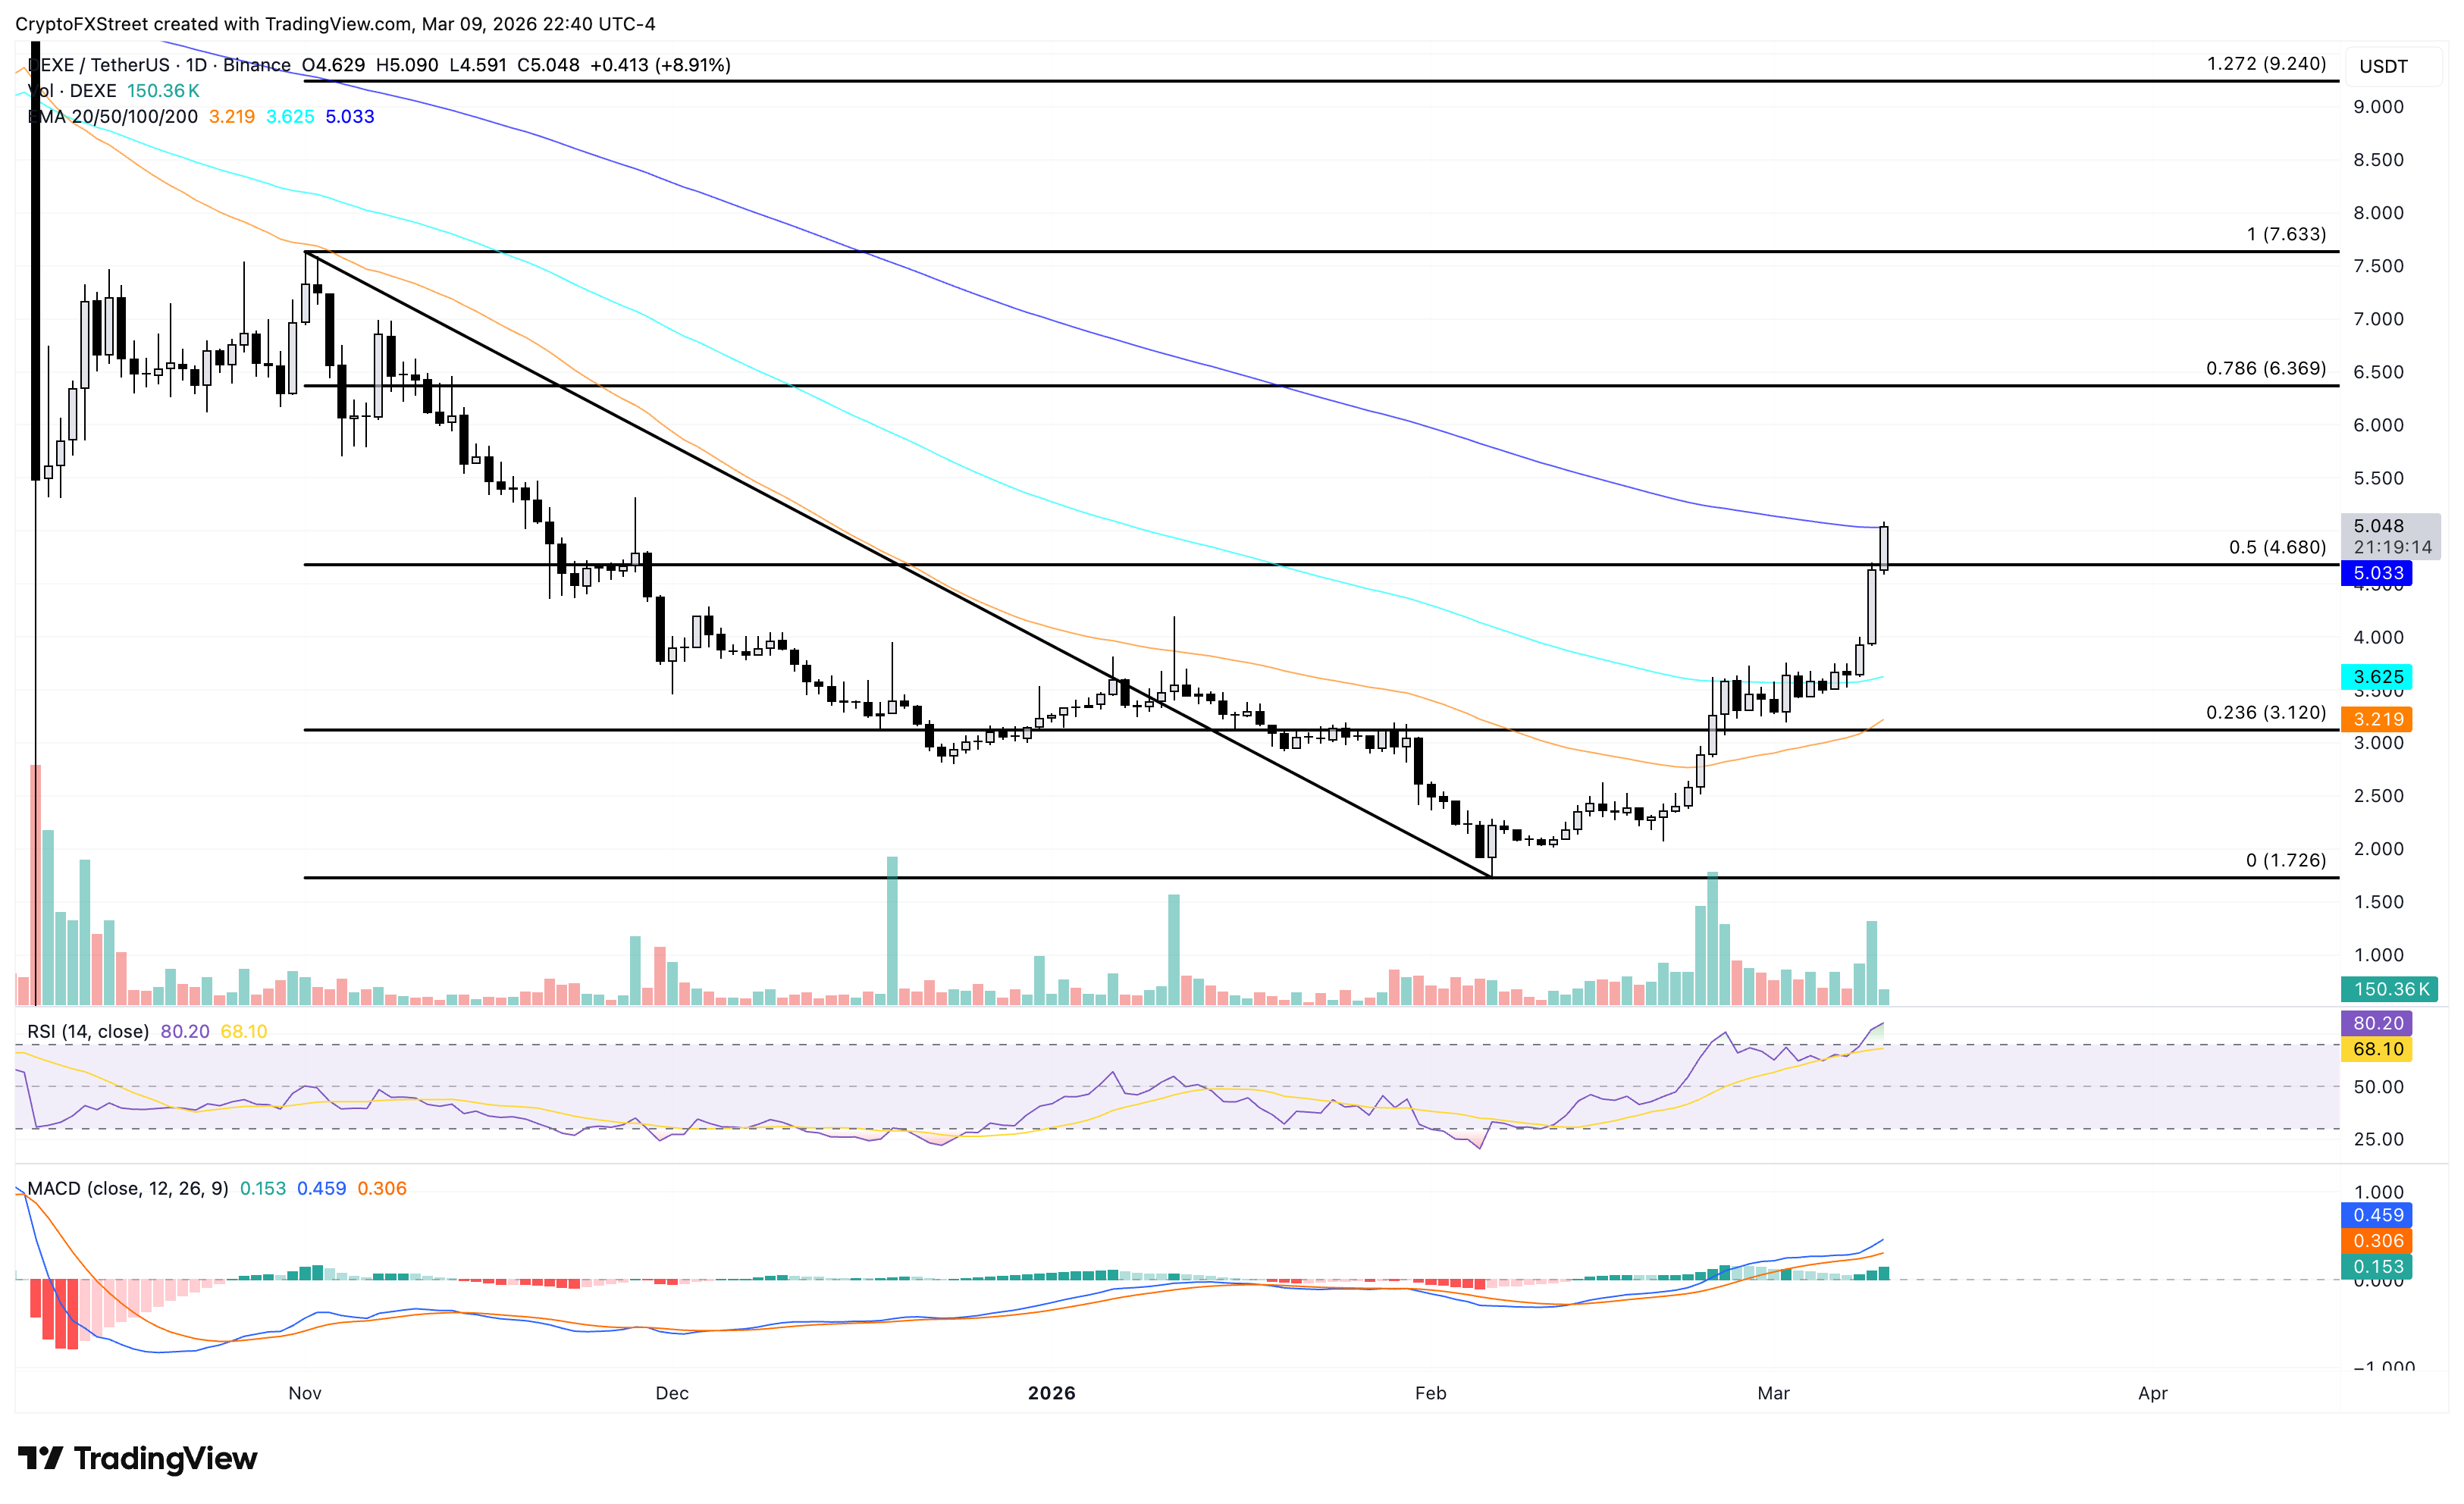
In case of a downside reversal, DEXE could find immediate support at the 50% retracement near $4.68, followed by the 100-day EMA at $3.62.
Hyperliquid recovery faces resistance near $35
Arthur Hayes, a well-known crypto investor, released a deep dive on Hyperliquid on Monday, highlighting it as a perpetuals-focused Decentralized Exchange (DEX) with strong revenue growth that has now expanded into commodities and plans to launch a prediction market, lifting retail sentiment.
Hyperliquid faces headwinds near the $35.51 level, which has capped gains since late November. At the time of writing, HYPE hovers above $34.00 on Tuesday, after a 12% rise the previous day.
For extended recovery, HYPE should secure a daily close above $35.51, which could extend its recovery to $40.00.
The MACD bounces off its signal line in the positive territory, expanding the bullish histogram while the RSI at 59 extends above its midline without reaching overbought territory, aligning with a scenario of recovering bullish pressure rather than exhaustion.
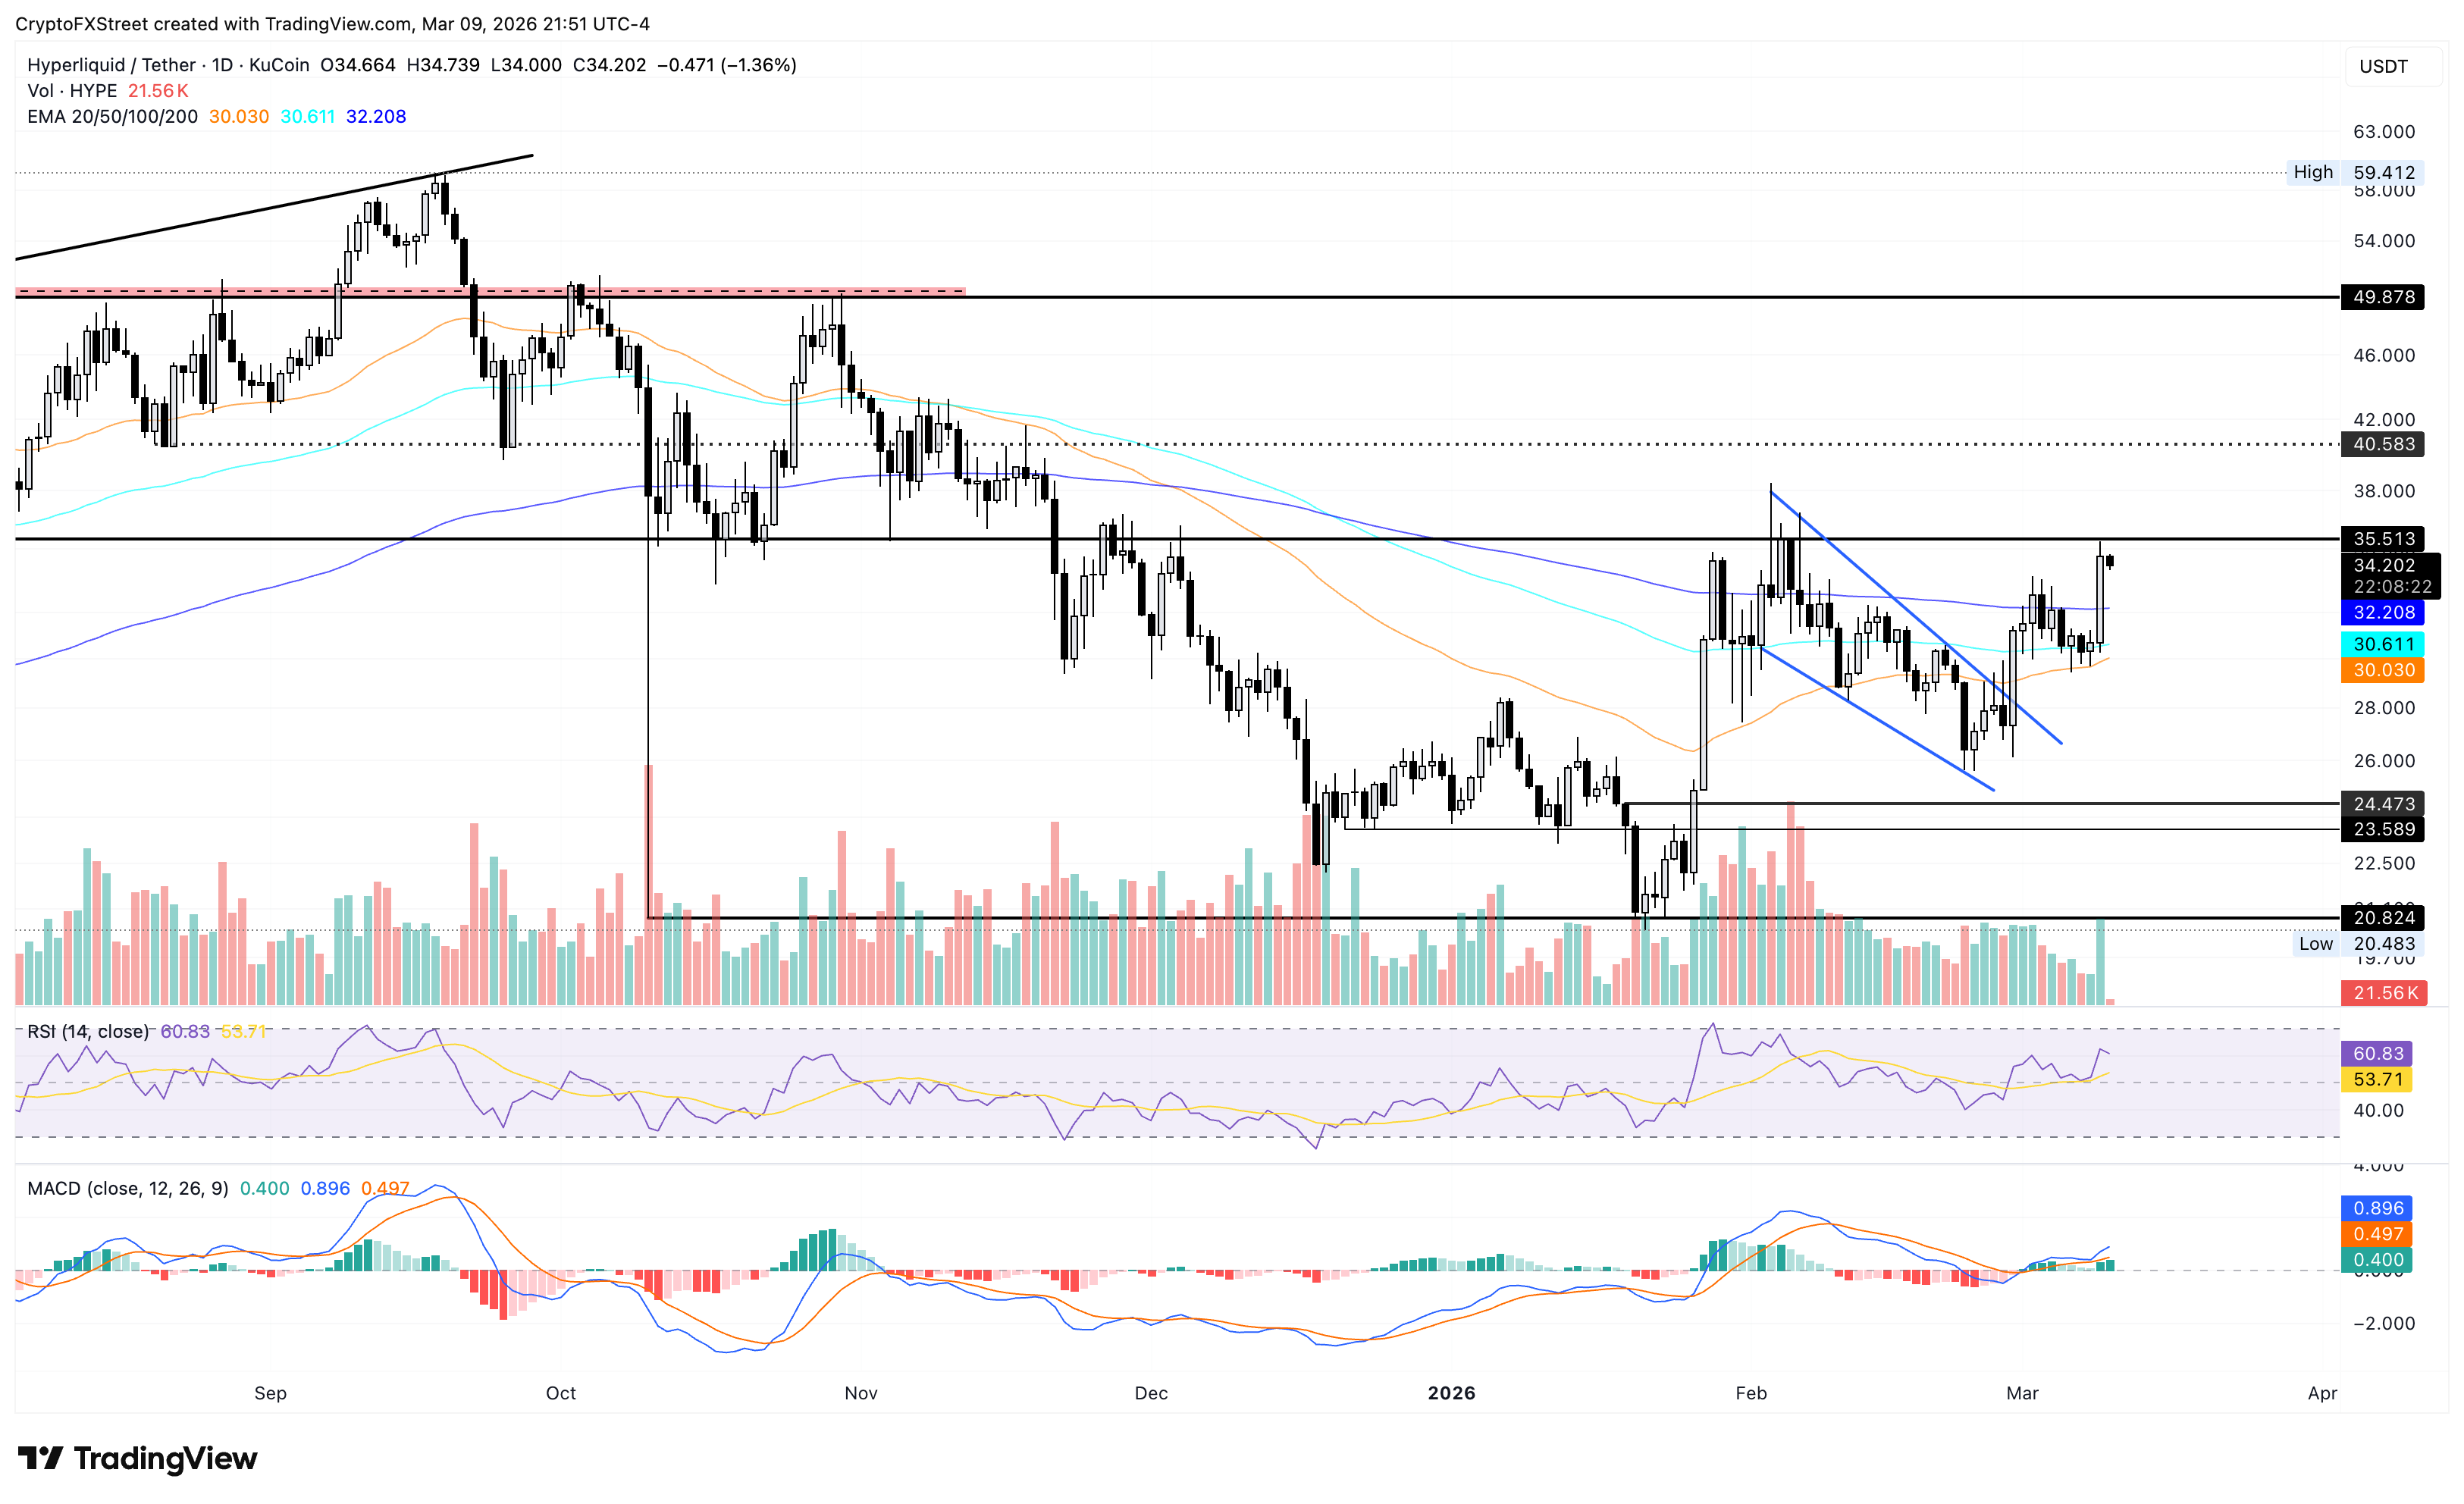
Looking down, support for HYPE emerges at the 200-day EMA at $32.20, followed by the 100-day EMA at $30.60 as the next key downside level.
Zcash rebound approaches crucial resistance trendline
Zcash is up 5% at press time on Tuesday, extending the 8% gains from the previous day. The privacy coin is gaining momentum after the Zcash Open Development Lab (ZODL) secured over $25 million in funding, signaling rising investor confidence in shielded ZEC adoption.
The near-term bearish bias is waning as ZEC approaches a descending resistance trend line near $250, connecting the December 29 and January 27 highs on the daily logarithmic chart.
The MACD remains merged with the signal line in negative territory, while the RSI rises to 43, reinforcing that sellers are gradually losing their grip.
If ZEC rises above $250, it could test the 23.6% Fibonacci retracement level at $362, measured from the August 20 low at $34.45 to the November 7 high at $750.
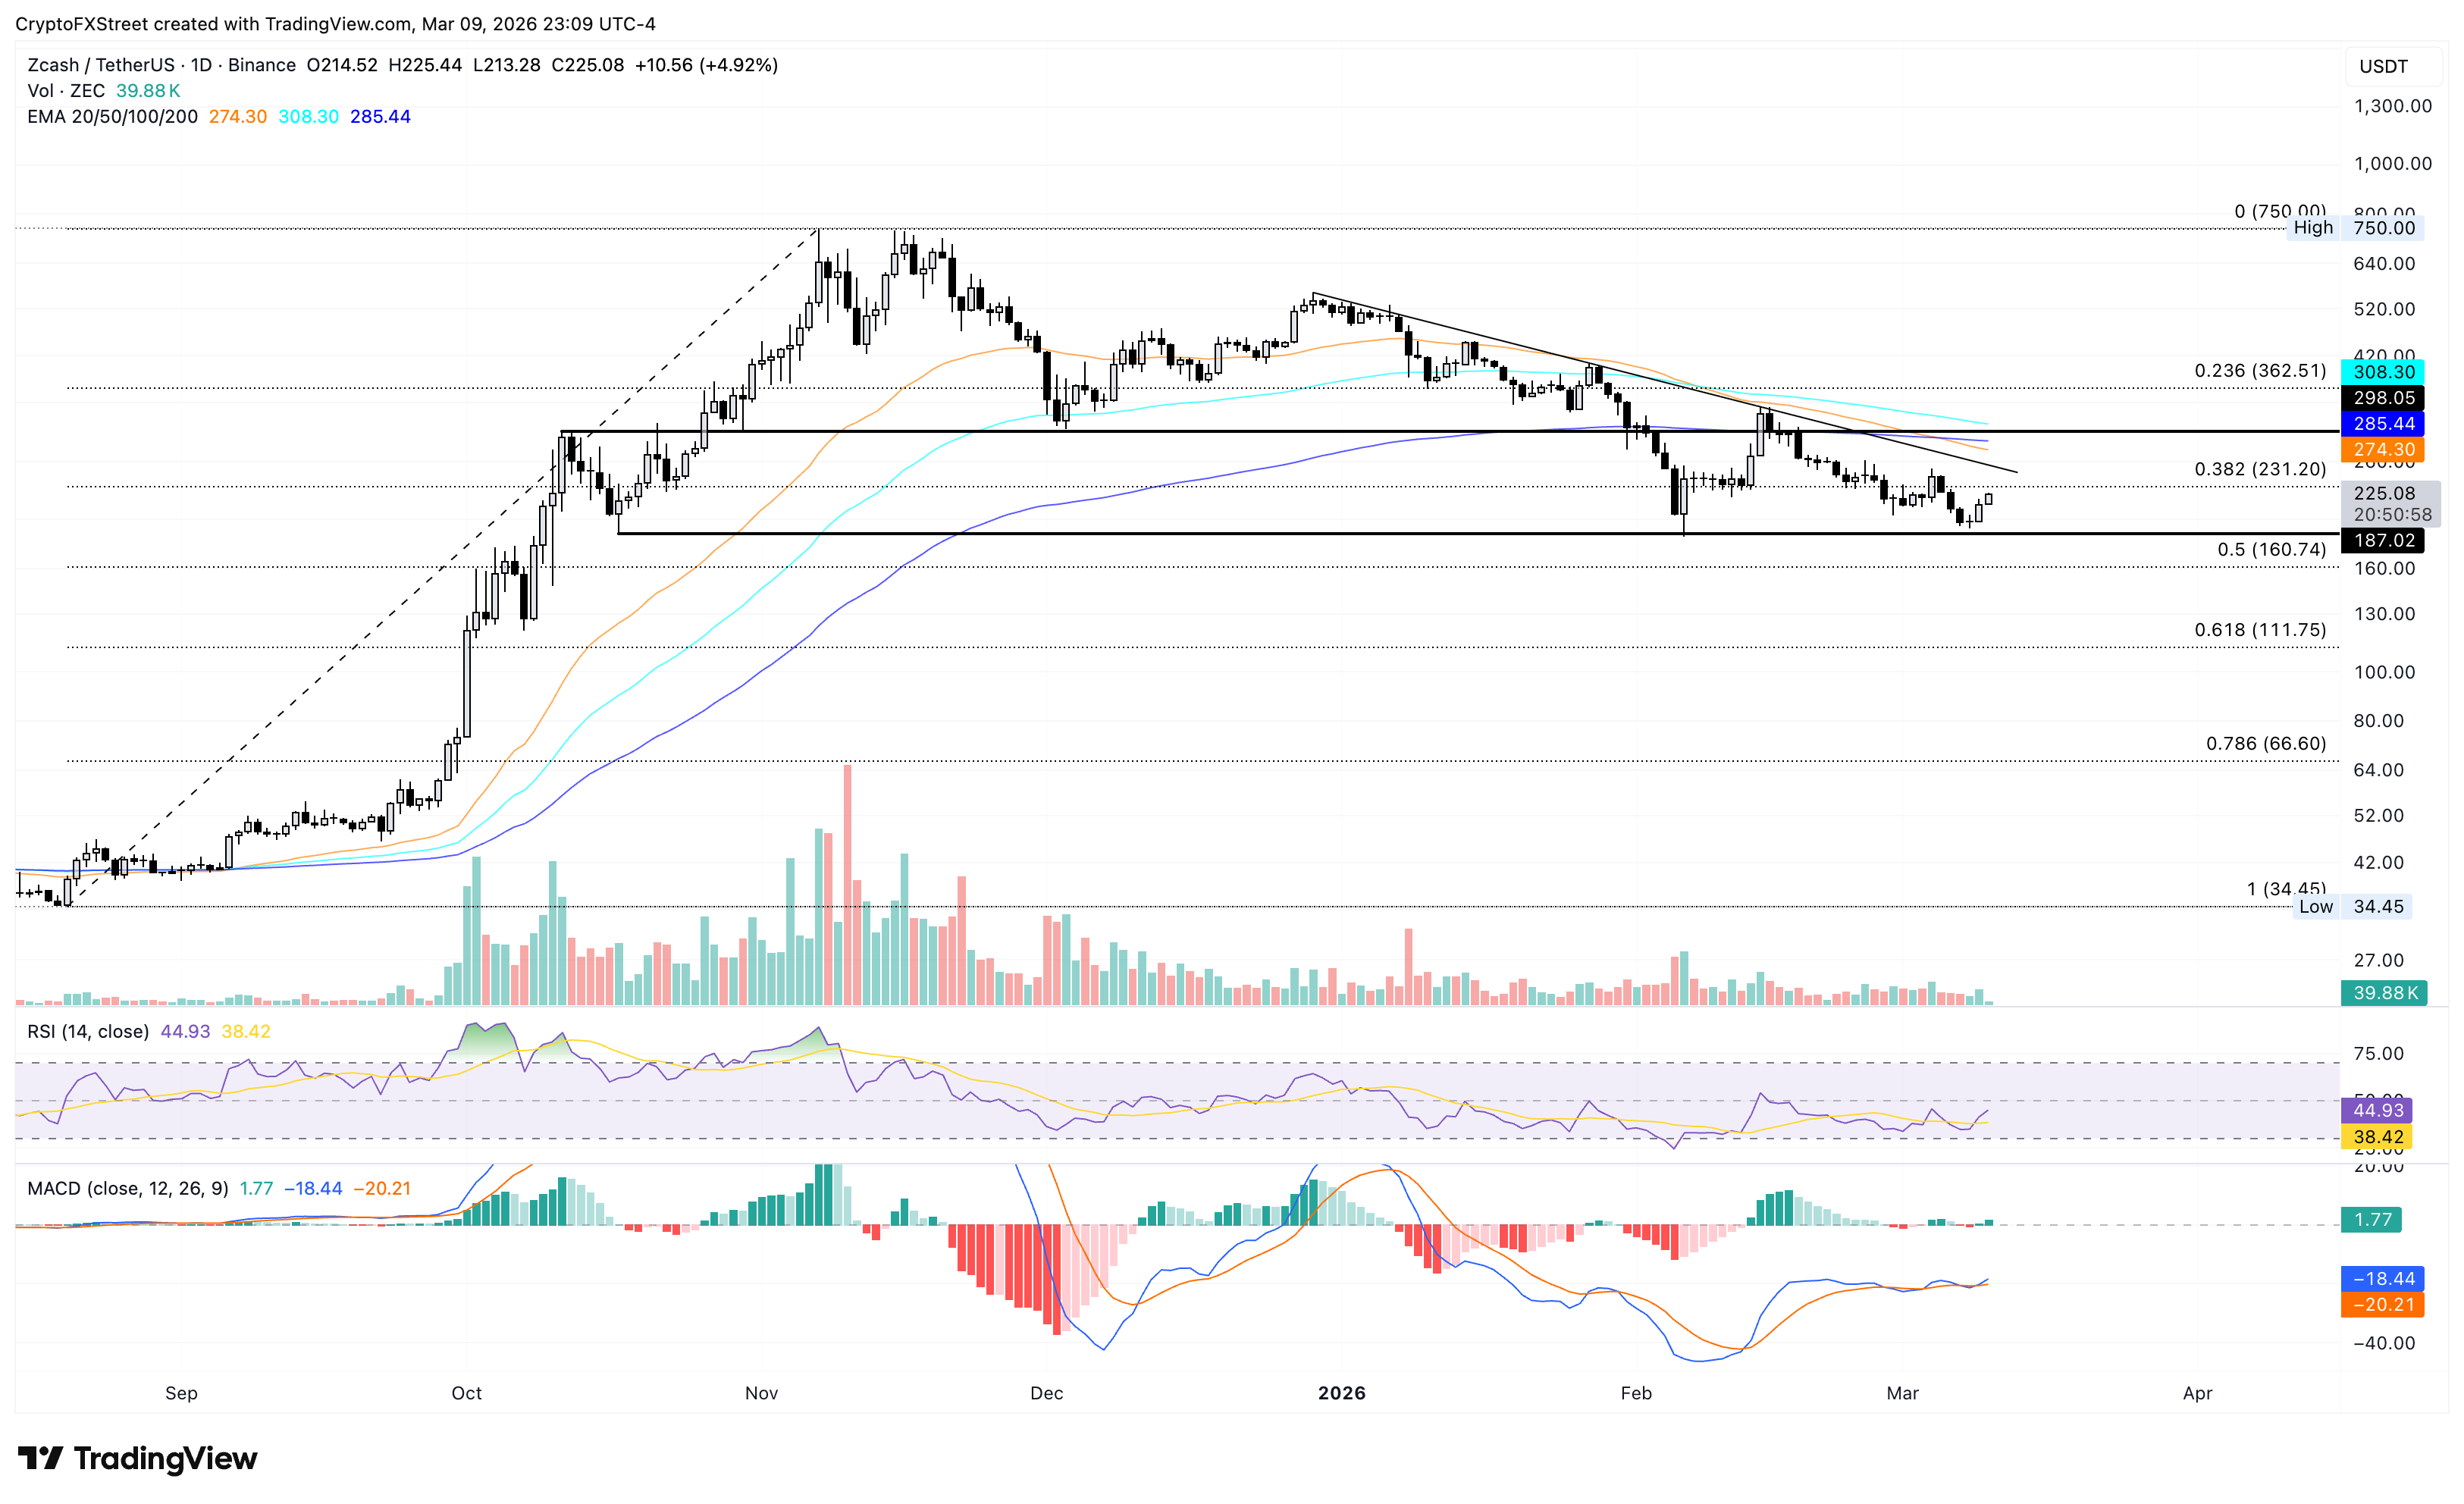
On the downside, immediate support is at the October 17 low at $187.
(The technical analysis of this story was written with the help of an AI tool.)
Author

Vishal Dixit
FXStreet
Vishal Dixit holds a B.Sc. in Chemistry from Wilson College but found his true calling in the world of crypto.