Top Altcoins Price Forecast: Ripple in a limbo near $1.50, Cardano extends rally, and Solana faces headwinds
- Ripple hovers around $1.50 on Tuesday, near the apex of a triangle pattern, suggesting an imminent breakout move.
- Cardano is up 3%, extending gains for the third consecutive day as bullish momentum persists.
- Solana edges lower for the second consecutive day, adding downside pressure amid ETF outflows at the start of the week.

Top altcoins, including Ripple (XRP), Cardano (ADA), and Solana (SOL), show mixed sentiment in the broader cryptocurrency market. Ripple hovers around $1.50, poised for a breakout from a symmetrical triangle pattern, while Cardano continues a steady recovery above $0.2700 and Solana struggles to hold above its crucial support level near $116.
Weak institutional demand
Solana-focused Exchange-Traded Funds (ETFs) recorded $9.25 million in outflows on Monday. Meanwhile, XRP-focused ETFs recorded zero inflow. This suggests a sharp increase in selling pressure due to investor redemptions, following less than $5 million in inflows last week.

Ripple eyes bullish breakout of a triangle pattern
Ripple hovers above the $1.5000 psychological level at press time on Tuesday, maintaining a bullish bias. The XRP price hovers above the 50-, 100-, and 200-period Exponential Moving Averages (EMAs) at $1.5010, $1.4855, and $1.4360, which collectively reaffirm a near-term constructive bias.
The XRP price also holds above the 50% retracement of the recent upswing from $1.2468 to $1.6548 at $1.4524.
From a technical perspective, the XRP price is approaching the apex of a triangle pattern formed by the two converging trendlines on the 4-hour chart. The overhead trend line lies near $1.5157, with a confirmed breakout potentially targeting the previous swing high at $1.6518.
Momentum on the four-hour chart remains mixed, with the Moving Average Convergence Divergence (MACD) marginally below its signal line, while the Relative Strength Index (RSI) at 49 hovers near its midline.
Looking down, the immediate support aligns with the 100-period EMA at $1.4855, near the rising support trend line at $1.4929. Any deeper pullbacks could test the 50% retracement level at $1.4524, reinforced by the 200-period EMA at $1.43359.
Cardano rally gains traction
Cardano hovers around $0.2790 at press time on Tuesday, extending a bullish near-term bias with three consecutive days of recovery. ADA price holds well above the 50-, 100-, and 200-day EMAs at $0.2265, $0.2160, and $0.2404, respectively.
The recovery has also reclaimed the 78.60% Fibonacci retracement at $0.2632, measured from $0.3136 to $0.1385, turning it into a nearby support level.
The MACD and signal line maintain an upward trend in positive territory, indicating positive momentum. However, the RSI near 71 shows overbought conditions.
On the topside, the 100% Fibonacci retracement and recent cycle high at $0.3136 act as the next key resistance to watch, followed by the 127.2% Fibonacci extension level at $0.3916.
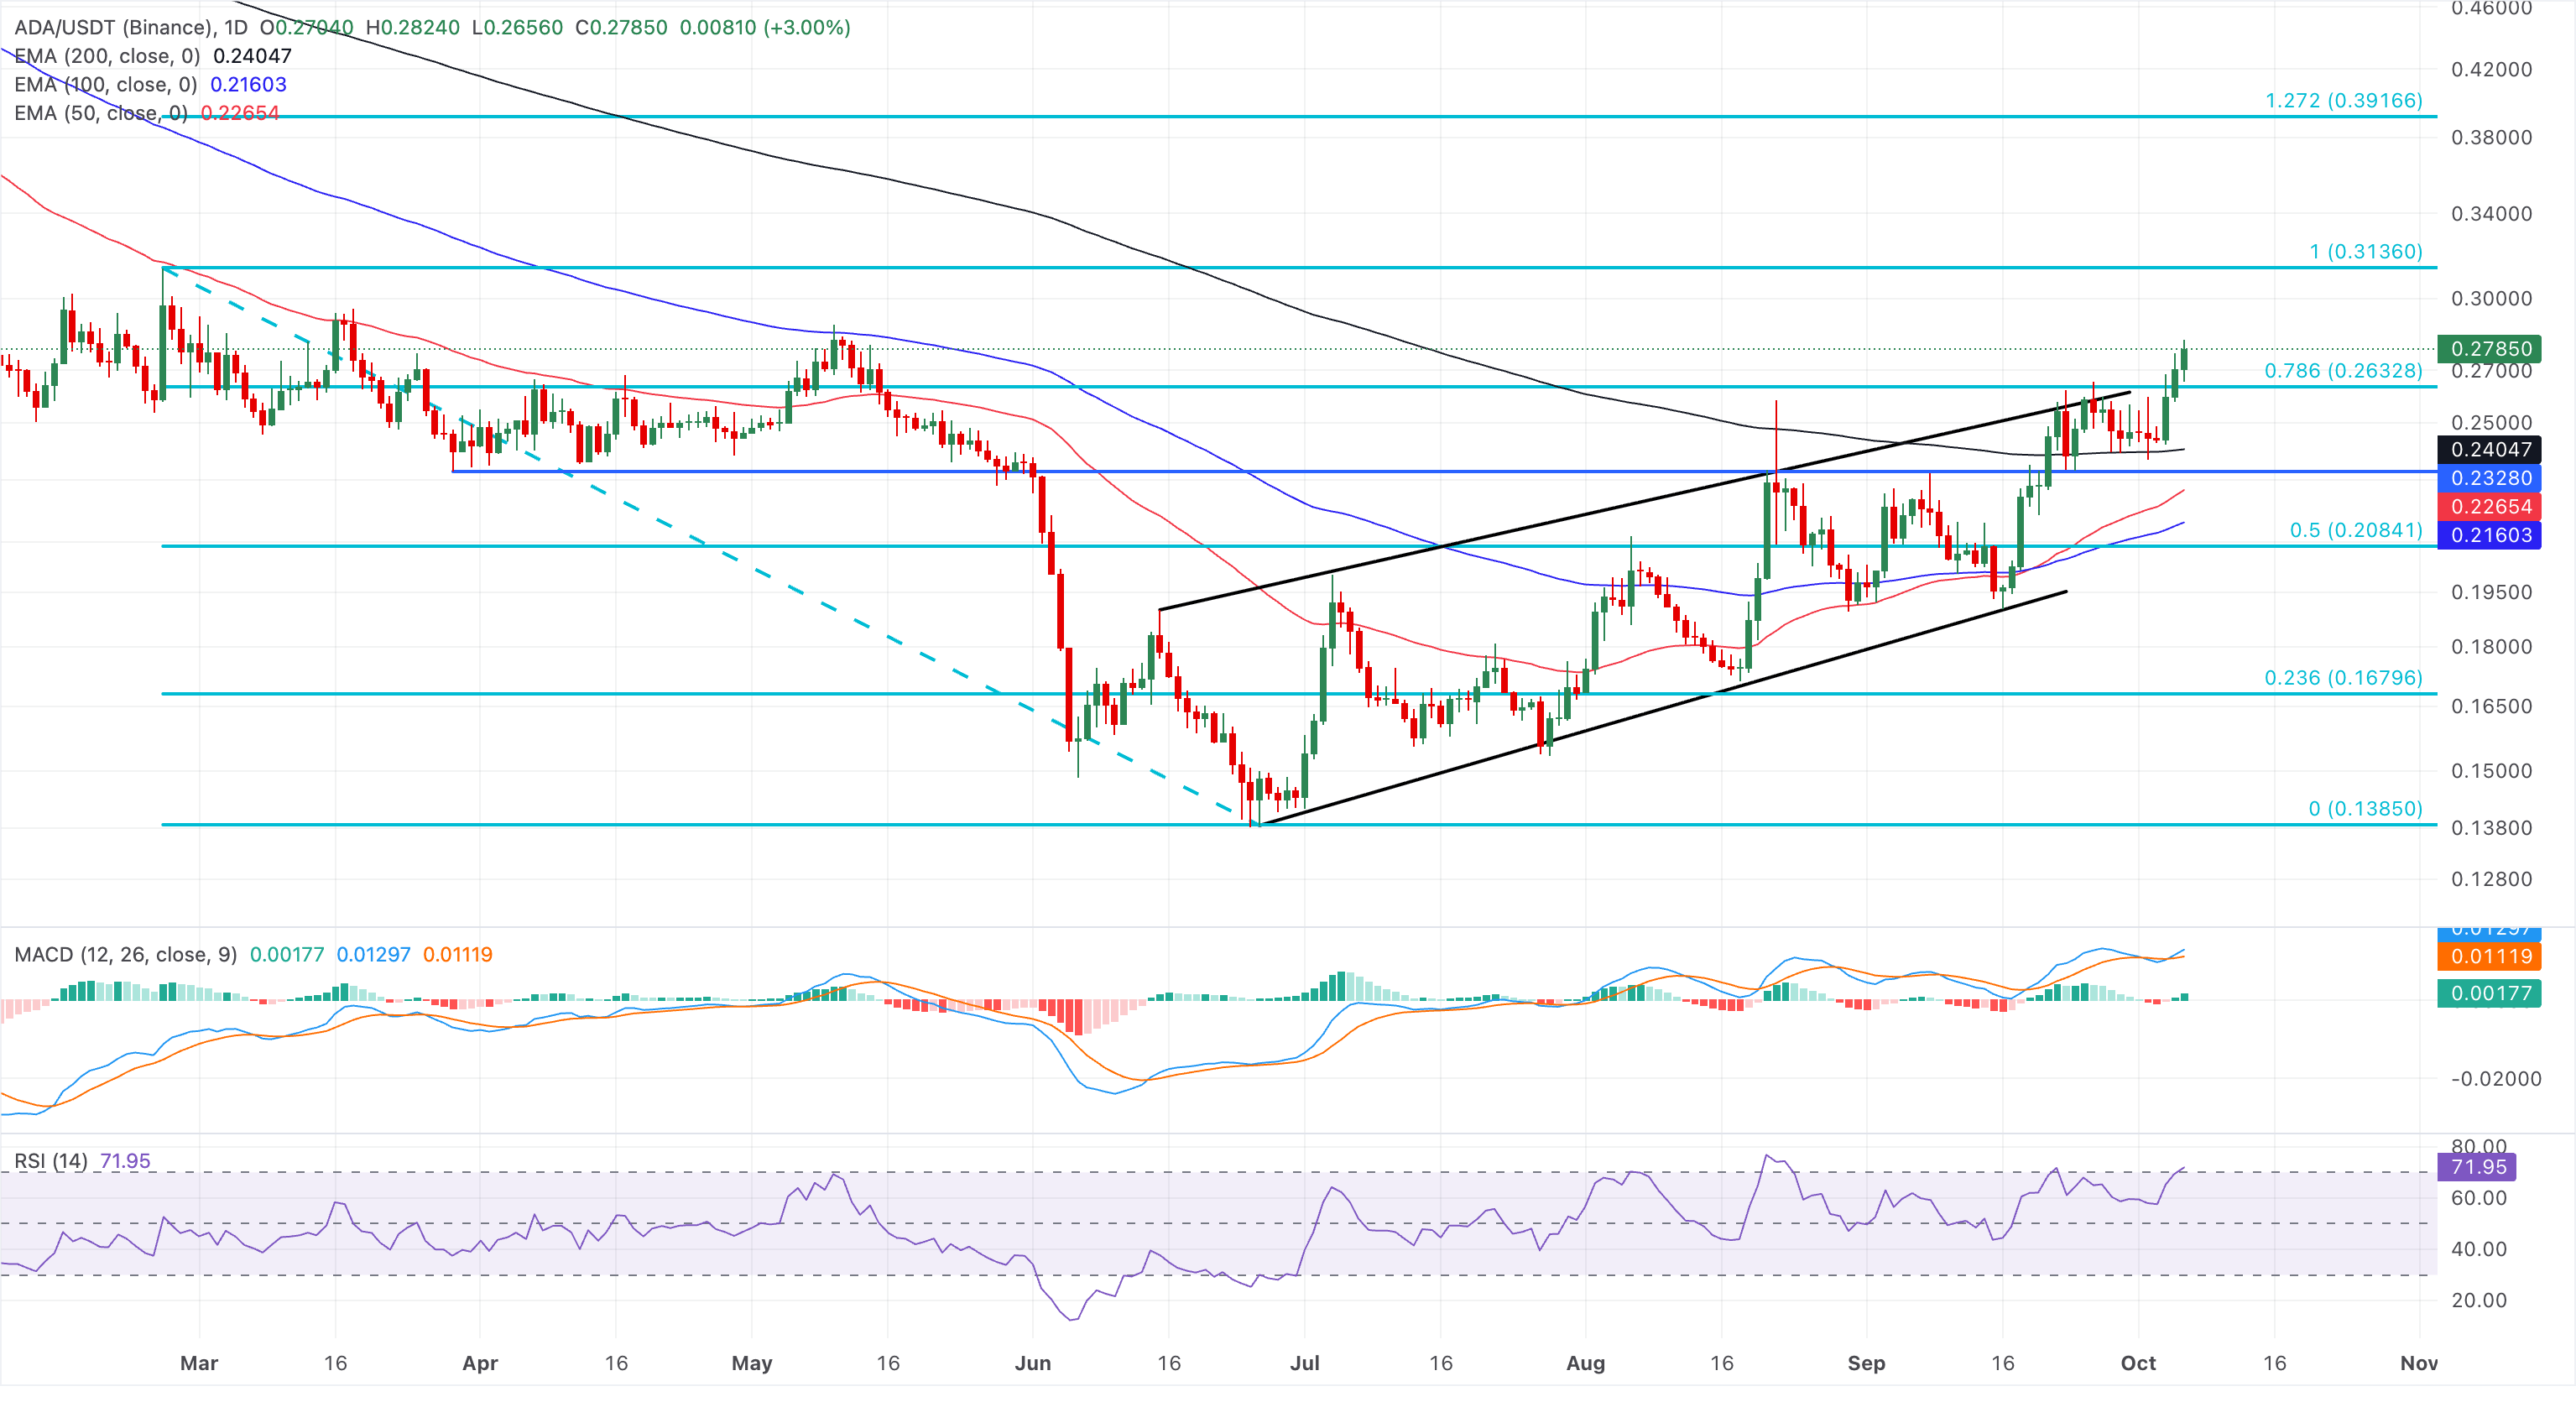
On the downside, immediate support is seen at the reclaimed 78.6% retracement level at $0.2632, followed by a broader demand band around the 200-day EMA at $0.2404.
Solana struggles to sustain its upward trend
Solana hovers around $119 at press time on Tuesday, maintaining a bullish near-term bias. SOL price holds well above the 50-day EMA at $106.69, the 100-day EMA at $97.74, and the 200-day EMA at $96.50. This stacked bullish configuration of medium- and long-term EMAs suggests underlying demand remains in place.
Momentum remains mixed as the MACD slipped below its signal line, flipping the histogram negative and hinting at a moderation in upside momentum. At the same time, the RSI around 61 still points to constructive, but no longer overextended, conditions.
The next notable resistance is the September 25 high around $122.94, which capped multiple upside attempts. A confirmed breakout above this level could target the January 13 high of $148.74, which could serve as a distant structural cap for any renewed rally.
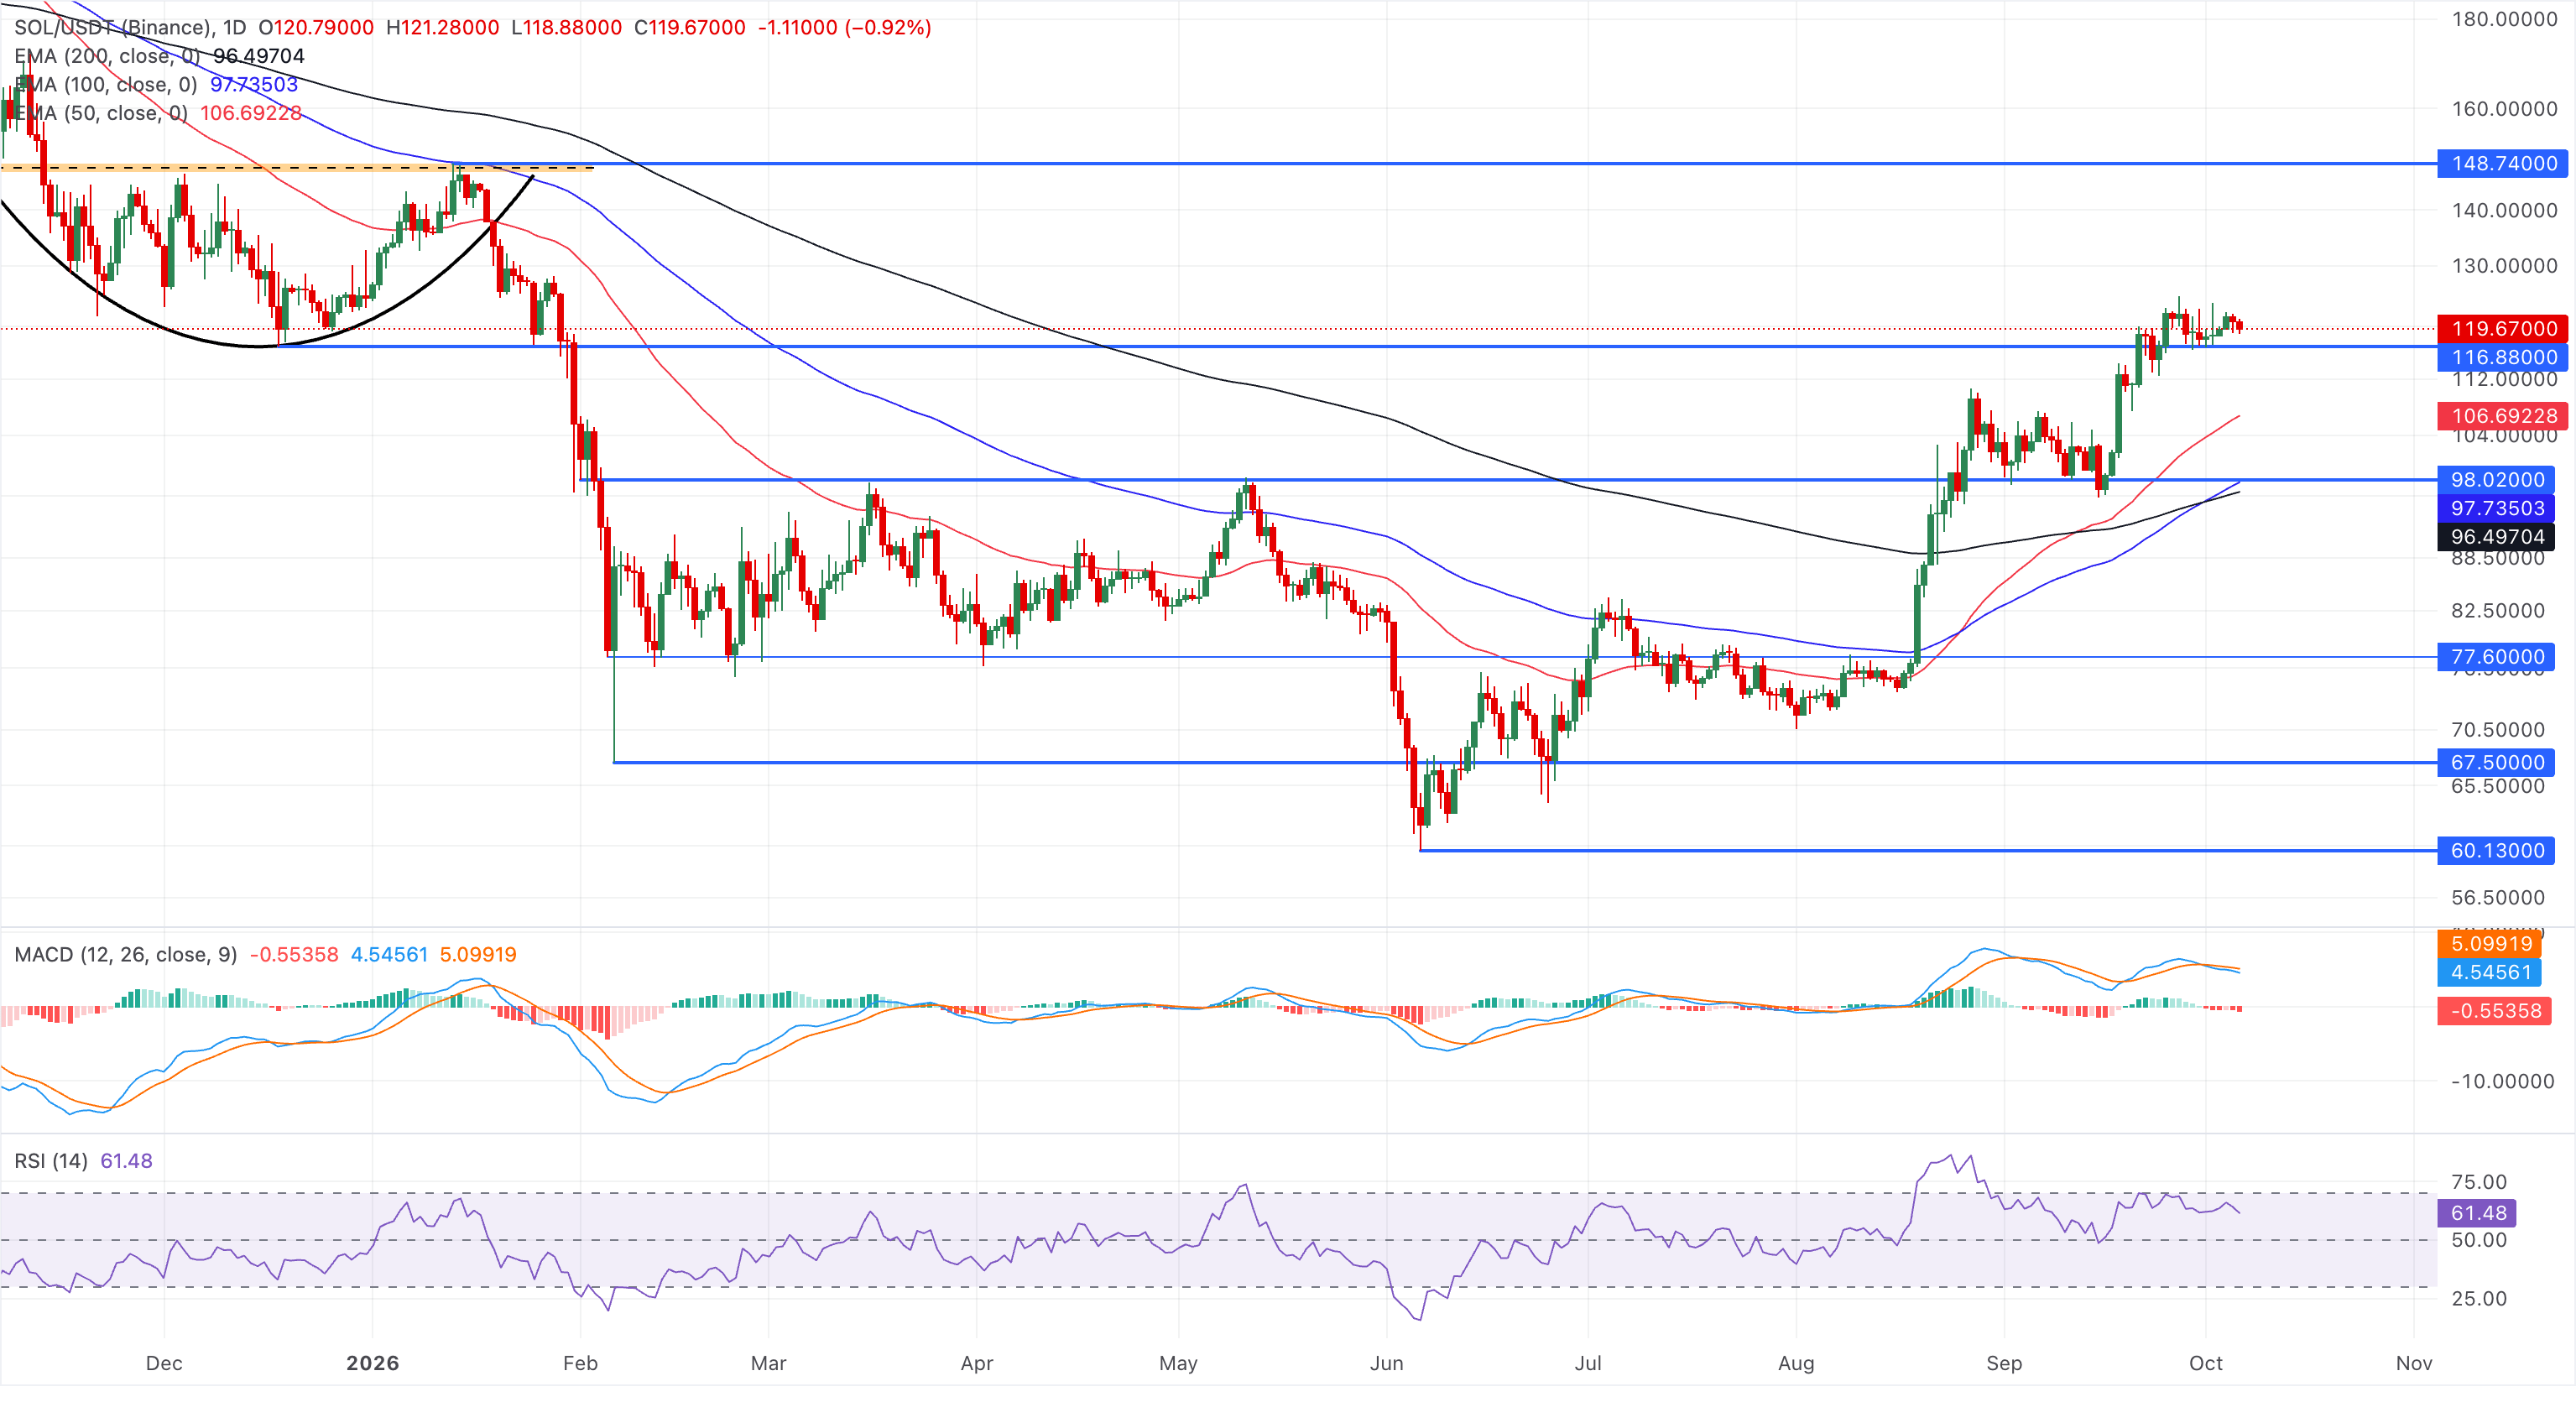
On the flip side, immediate support is seen at the December 18 low at $116.88, followed by the 50-day EMA at $106.69, with deeper demand levels aligning at the 100-day EMA near $97.74 and the 200-day EMA at $96.50.
(The technical analysis of this story was written with the help of an AI tool. Know more.)
Author

Vishal Dixit
FXStreet
Vishal Dixit holds a B.Sc. in Chemistry from Wilson College but found his true calling in the world of crypto.