Top 3 Price Prediction Bitcoin, Ethereum, Ripple: last breath or rebirth for Ethereum?
- BTC/USD remains in the same range despite recent gains.
- ETH/USD regains some pace and returns to the trading floor.
- XRP/USD benefits from Bullish Beta Search.

It is a good morning in Europe with marginal downturns on the Crypto board after yesterday’s upbeat session. The most noteworthy fact in Thursday’s rally was the strong rise of Ethereum against Bitcoin. As the kind readers who read my analysis on a regular basis know, I follow the ETH/BTC pair closely because I consider it to be a good indicator of the underlying directionality in the market.
There has been no consistent rise in the Cryptocurrencies market where Ethereum did not behave better than Bitcoin.
This pattern has to do with the "Risk-on/Risk-off" concept. When the market considers that the risk decreases, it looks for more volatile assets that take advantage of the upward trend. When the market perceives that there are risks that can damage prices, it looks for the most consolidated assets or those considered to be the safest, thinking that they will suffer less in times of falls.
Well, it seems that the market is beginning to seriously consider going into "Risk-off" mode. The more advanced, and therefore less risky (close stops), were positioned yesterday on the side of Altcoins, which generally behaved much better than Bitcoin. It is not yet possible to confirm that what we have seen in the last few hours is an upward movement in the medium term. Let's see the following chart to see at what level we will have the answer.
In this daily chart of the ETH/BTC, we see how the trend has been strongly bearish since the last bullish stretch of the market last April.
ETH/BTC 1-D
-636725169745999697.png)
In August, Ethereum lost the long-term bullish trend line against Bitcoin and has paid for it with sharp declines. Wednesday left a "Flying Dragon" figure in candlestick which was completed yesterday with an excellent large body bull candle.
The pair's level is currently at around 0.0325, having as the first resistance the level of 0.035 (mid-term bearish trend line). The next resistance level is 0.045-0.050 ETH/BTC (long-term bullish trend line and 23.6% Fibonacci reversals). Only above this level, we could say that the worst is over and that the market is bullish in the long term, again.
BTC/USD 240-Min.
The BTC/USD is currently trading at the $6.532 price level after reaching price congestion resistance at $6.560. It moves above the EMA50 which becomes support. It is negative the appearance of a Doji at the maximum, so it is not over an extra dose of caution.
Above the current price, the first resistance at the recent high at the price level of $6.560 (price congestion resistance). Then next resistance is at $6,600 (SMA200) and as a third hurdle, we note $6,730 (SMA100).
Below the current price, the first support is at $6.461 (EMA50), tested at the time of writing. The next support level is at $6,400 (price congestion support). Finally, we see support at $6,200 (price congestion support) as this was the level that stopped the drop from relative highs at $7,400.
Follow the chart, you can open it and after registering, save it for your personal use.
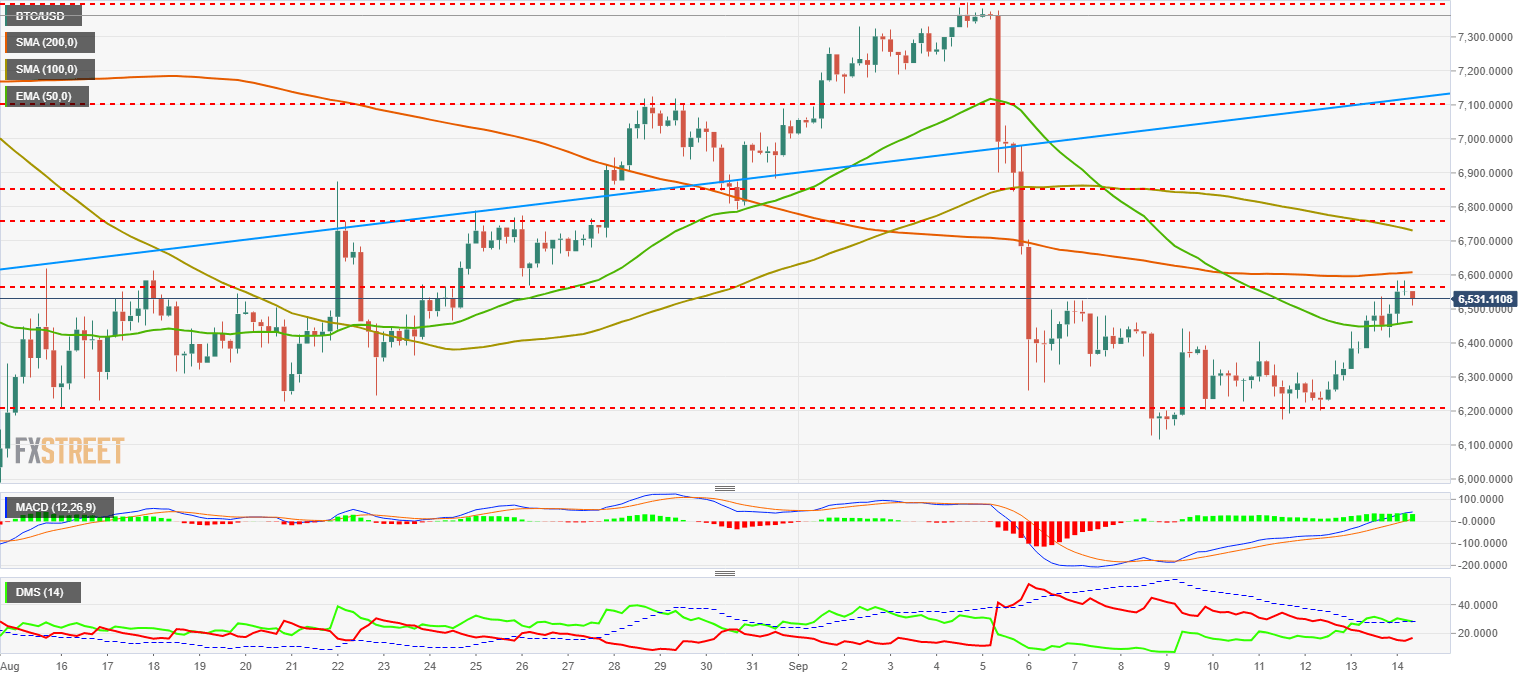
The MACD at 240-Min does not show an indicator above the zero line that seems to take the level well achieved and prepares to rest a bit on the way to the upside.
The DMI at 240-Min shows a confirmation pattern, in which the bears increase activity again and thus test the strength of the bulls and their determination.
ETH/USD 240-Min
The ETH/USD leaves the maximum movement at the price level of $220 (price congestion resistance) and is currently trading at $206, just below the EMA50.
Above current price, the first resistance at $220 (price congestion resistance and relative maximum). The next resistance is at $242 (SMA100) and the third resistance level awaits at $265 (SMA200).
Below the current price, the first support is at $206 (EMA50), which Ethereum may lose at the close of the current candle. The next support level is at $194 (price congestion support). As the last support level, the relative minimum at $167.5.
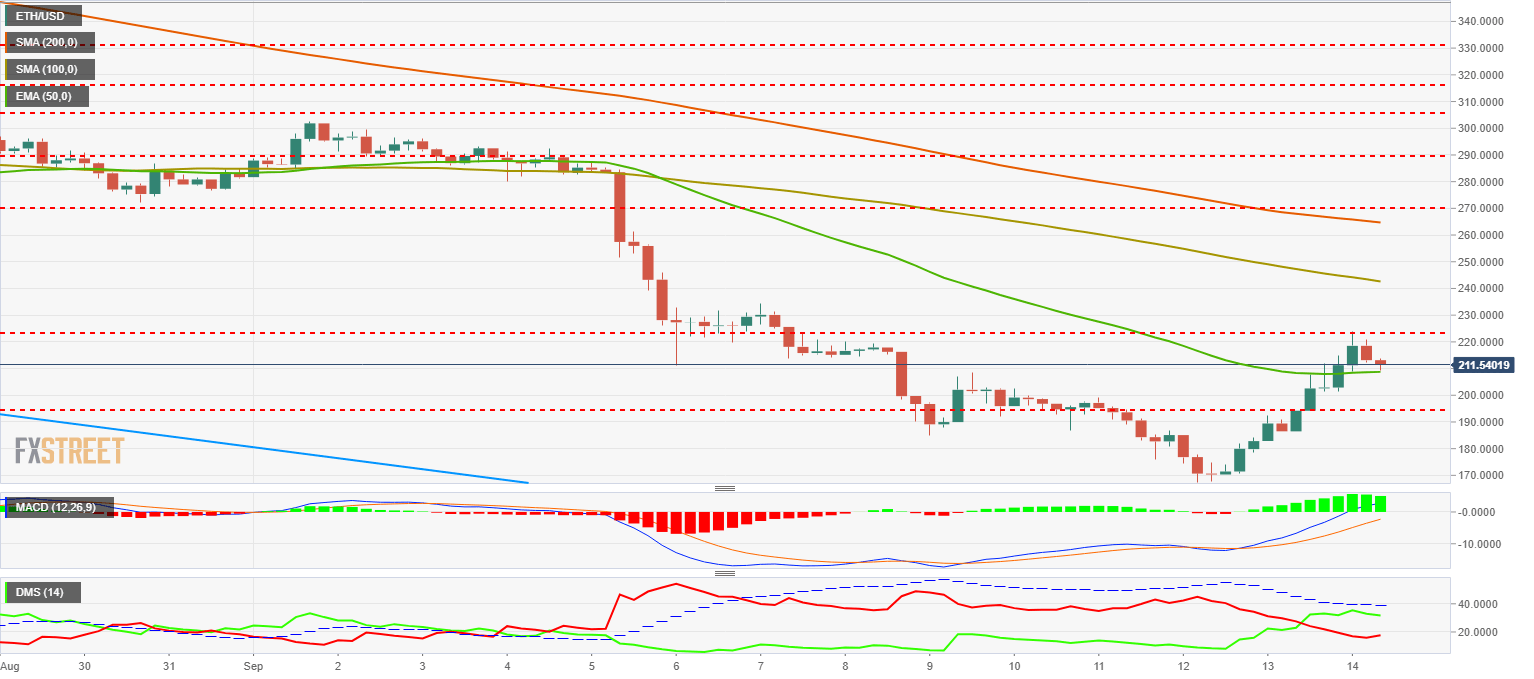
The MACD at 240-Min shows a very positive profile from the bulls' point of view. It is not just above the zero line, but almost certainly, it will end up doing so even with the recoil movement that seems to be starting.
The DMI to 240-Min shows the same pattern seen in the BTC/USD. There is a new attempt of the bears to drag the price down again.
XRP/USD 240-Min
The XRP/USD reached the price level of $0.285 yesterday but never managed to close above the EMA50 at $0.282. It leaves a small Doji that gives it a bearish point. It is currently dropping to the $0.276 level.
Above the current price, the first resistance is at $0.282 (EMA50 and the relative maximum) followed by $0.297 (price congestion resistance). The third key resistance level is in the range between $0.305 and $0.311 (SMA200 and SMA100). If Ripple does not pass this level, there is no uptrend in the medium term.
Below the current price, the first support is at $0.271 (price congestion support) with a second support level at $0.257 (price congestion support). If it were to lose this level, Ripple would have the last chance at $0.252 (relative lows).
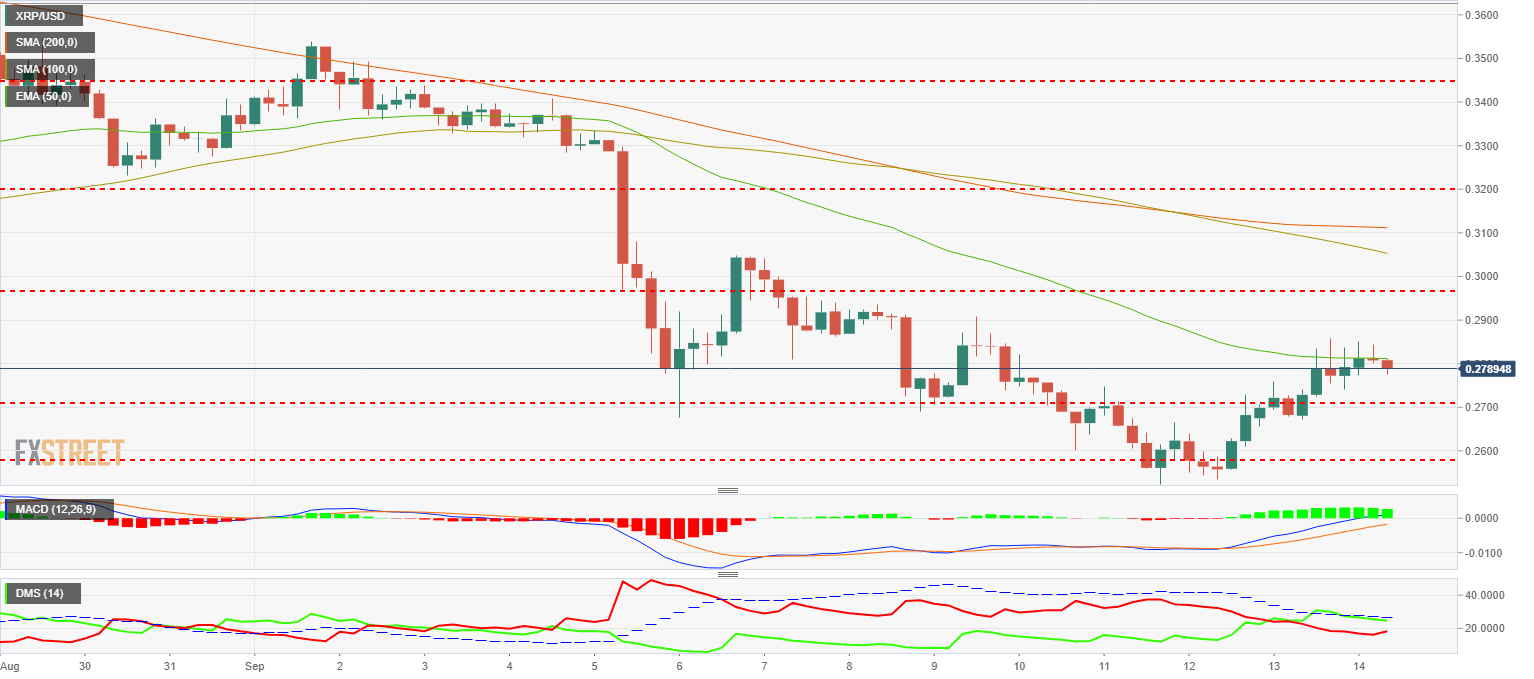
The MACD at 240- Min is not sufficient to be clearly above the zero line. By inclination and opening, it can achieve it but it is, of the three, the one that has it in this aspect.
The DMI at 240- Min repeats the same pattern as its analysis partners, the bears are trying to regain control of the situation.
Author

Tomas Salles
FXStreet
Tomàs Sallés was born in Barcelona in 1972, he is a certified technical analyst after having completing specialized courses in Spain and Switzerland. He expanded his technical training following the guidance of great experts on the financial markets.


