Zcash Price Forecast: On-chain weakness, mounting selling pressure point to further losses
- Zcash tests a crucial support trendline near $460 on Wednesday after falling around 20% over the last 10 days.
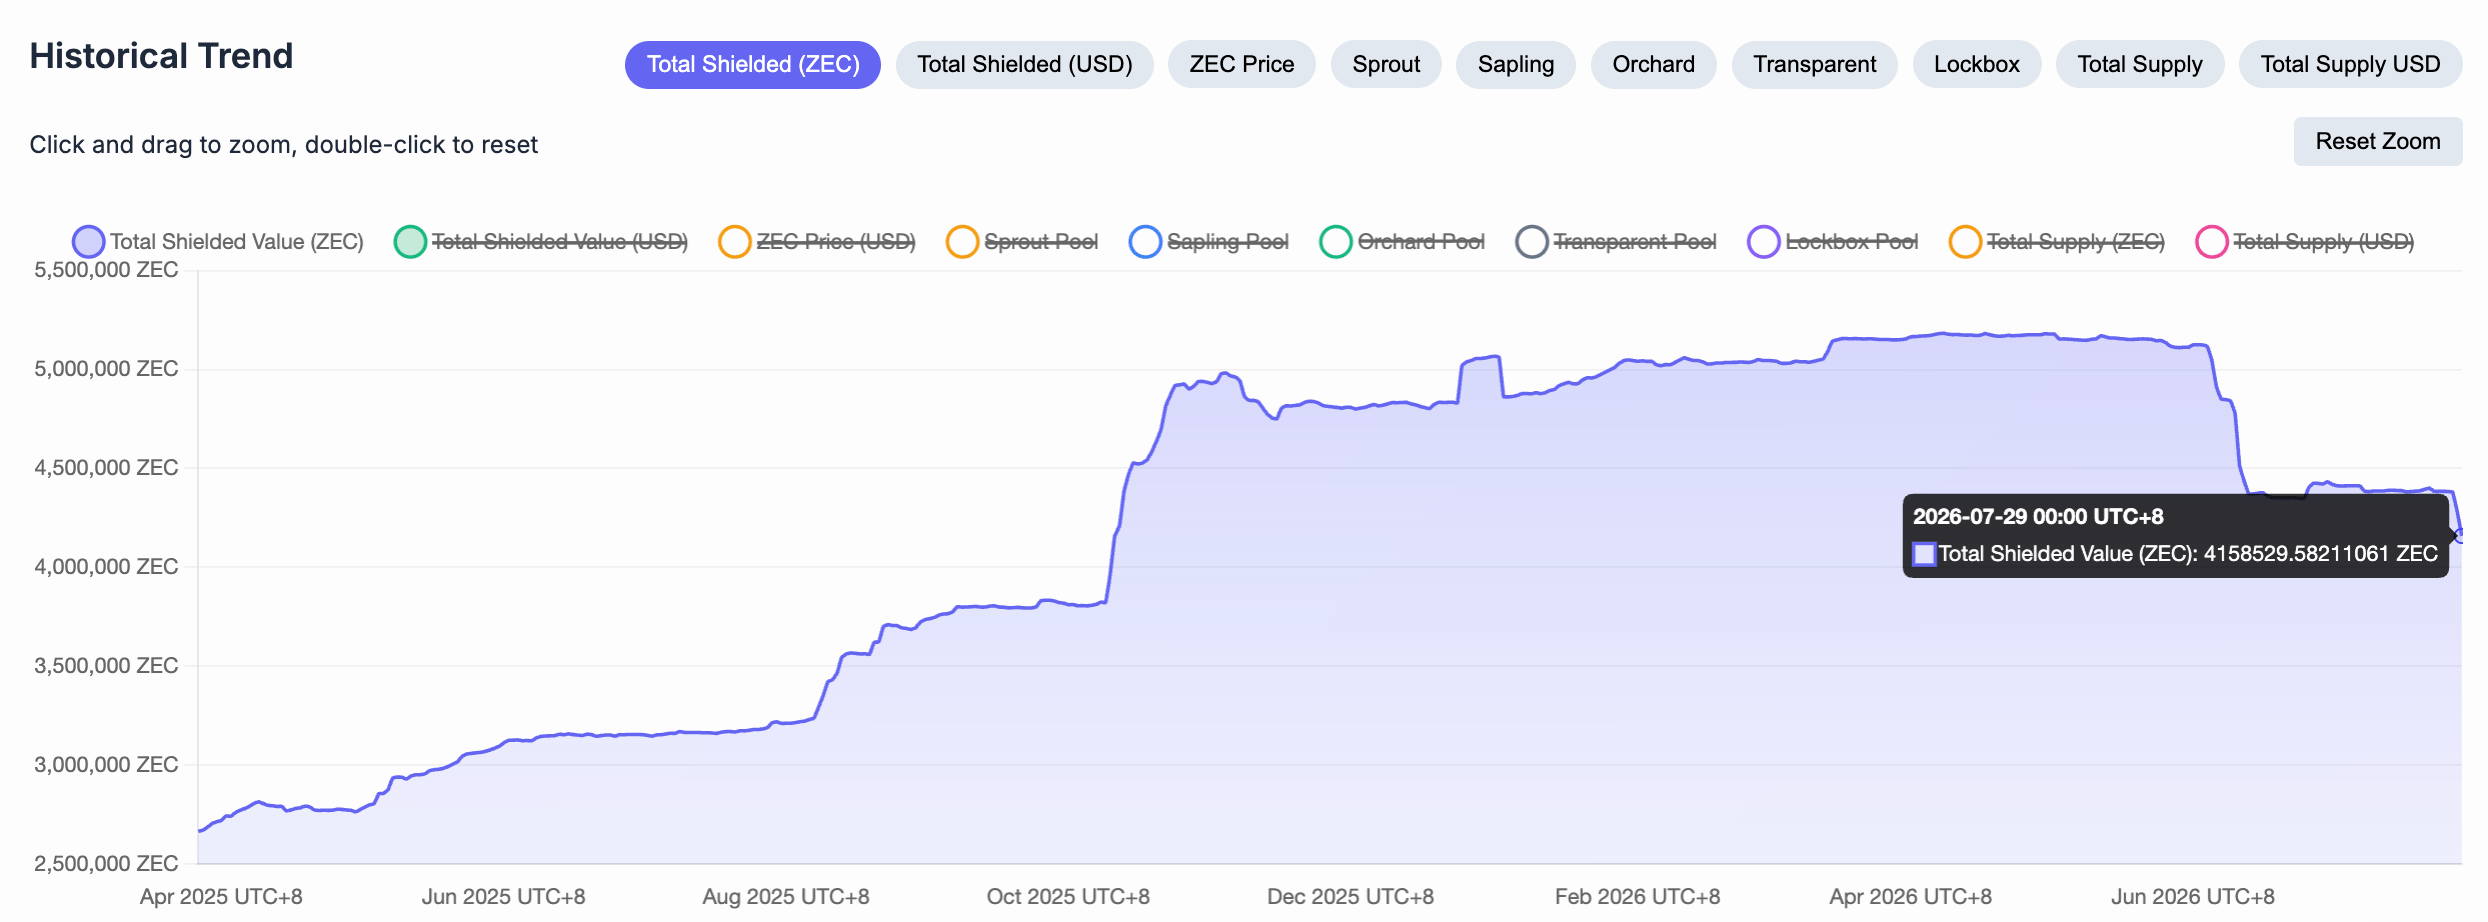
- Total shielded value has fallen to 4.15 million ZEC, from 5.11 million ZEC in early June, signaling weaker demand for the privacy token.
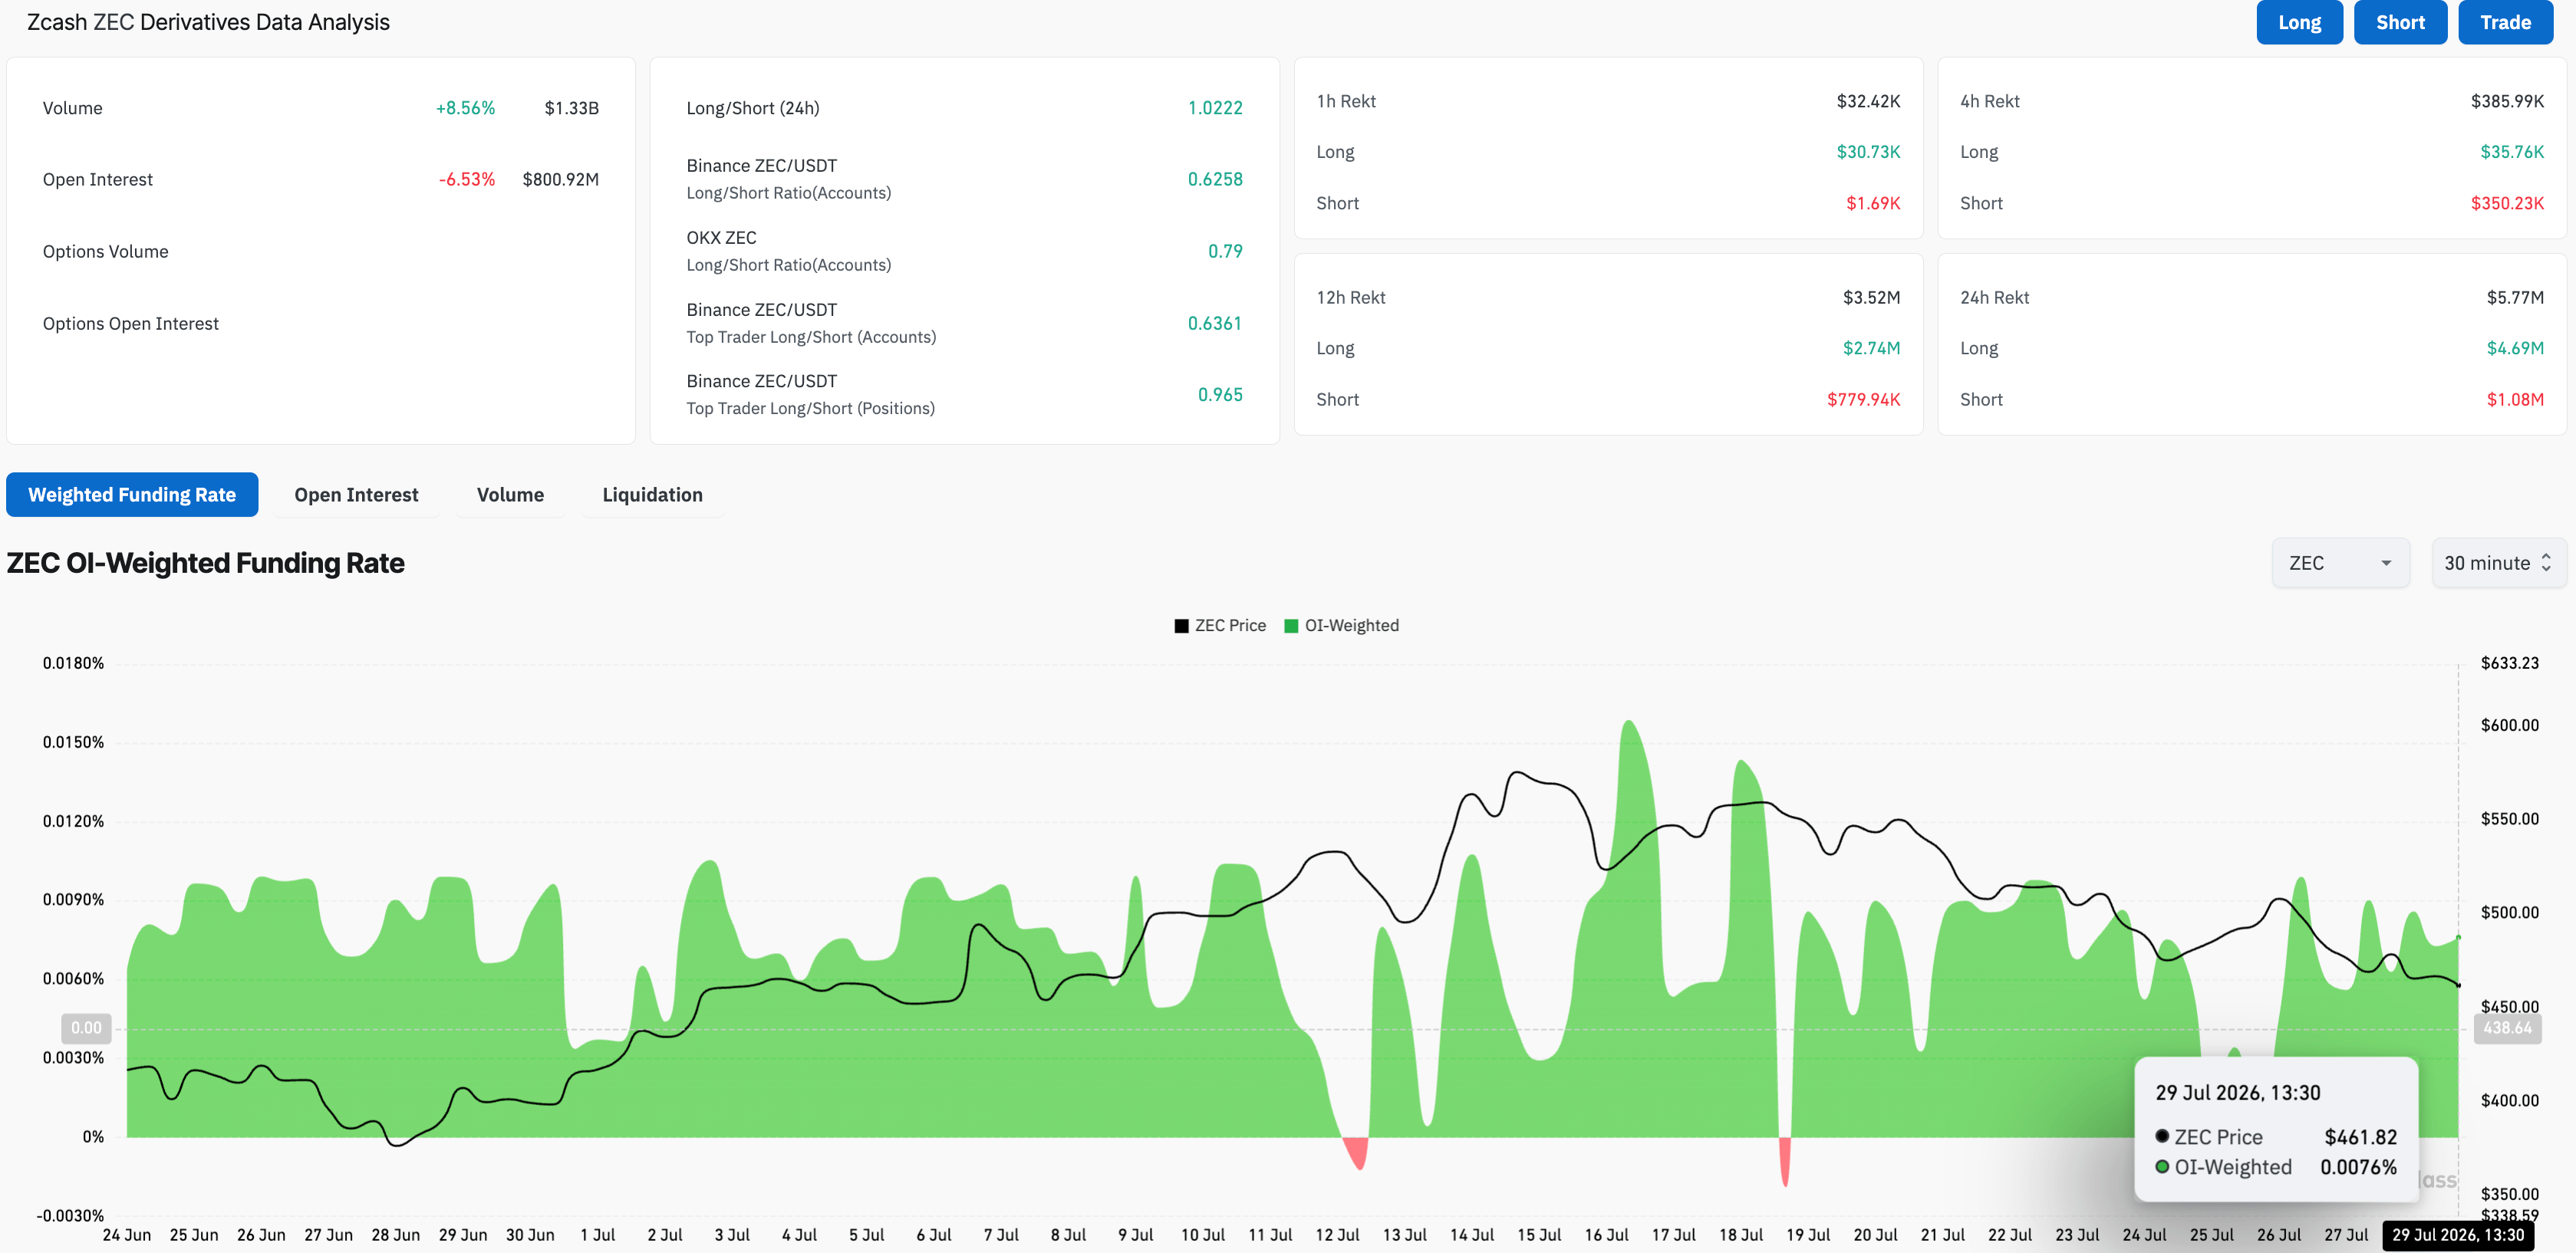
- Retail participation in ZEC futures is waning, with Open Interest declining despite stable, positive funding rates.

Zcash (ZEC) trades around $460 on Wednesday, stabilizing after a 20% decline over the last 10 days. The privacy coin is losing its retail demand, and network usage is declining, with Open Interest falling 6% in 24 hours and shielded ZEC count down to 4.15 million tokens. The technical outlook for ZEC is mixed, with the price testing a crucial support trendline amid rising bearish momentum.
Retail demand and network usage are down
Zcash is losing its hype in the crypto market as the broader sentiment turns risk-off ahead of the US Federal Reserve (Fed) rate decision, as previously reported by FXStreet. Zkp.baby data shows a sharp drop in network usage, with the total shielded value down to 4.15 million ZEC from 5.11 million ZEC in early June, reflecting reduced use of the privacy token.
On the retail side, CoinGlass data show that ZEC futures Open Interest (OI) is down over 6% in the last 24 hours to $800.92 million, indicating a reduced notional value of active contracts. Meanwhile, a total liquidation of $5.77 million in the same period, led by $4.69 million in long liquidations, indicates a sell-side-dominant positional wipeout.
However, the positive funding rate of 0.0076% indicates that buyers continue to acquire long positions at a premium, anticipating a potential rebound.
Technical outlook: Will ZEC price hold above $460?
Zcash hovers above $460 on Wednesday, maintaining a near-term bearish bias with a steady downward trend since July 19. The privacy coin is trading below the 50-day Exponential Moving Average (EMA) at $487, while holding above the 200-day EMA around $405 and the 50% retracement of the upswing from $207 to $690, at $378. In addition, the price is also hovering just over the rising support trendline near $460, connecting the lows of March 29 and June 28.
Momentum has softened, with the Relative Strength Index (RSI) at 42 on the daily chart trending downward below the midline as selling pressure emerges. Meanwhile, the Moving Average Convergence Divergence (MACD) and signal line are lowering toward the zero line after a bearish crossover on Thursday, reaffirming renewed downside momentum.
A decisive close below $460 could confirm the support trendline breakout, opening the path toward the 200-day EMA at $405, followed by the 50% retracement level at $378.
On the topside, initial resistance emerges at the 50-day EMA at $487, with a subsequent barrier aligned with the descending resistance trendline around $564.
(The technical analysis of this story was written with the help of an AI tool. Know more.)
Author

Vishal Dixit
FXStreet
Vishal Dixit holds a B.Sc. in Chemistry from Wilson College but found his true calling in the world of crypto.



