TOP 3 price prediction Bitcoin, Ethereum, Ripple: Does Bitcoin decouple itself from the market or is it just "The Market"?
-
BTC/USD reaches $8,000 and it doesn't look like it's going to stop rising.
-
ETH/USD remains stable and confirms its decoupling among the Majors.
-
XRP/USD is also still waiting for a technical signal that could come today.

Bitcoin follows the script I already set out yesterday and continues its path upwards regardless of what the other big Cryptos are doing. The news about the approval of an ETF on Cryptos before the end of the year warms the price and reveals a high degree of desire on the part of investors not to miss the rise.
The evident decoupling between Bitcoin and the rest of the main Cryptos was something that the technical analysis had been showing for days.
What can we get out of studying this? Well, I dare say that it confirms that the rise of Bitcoin is serious since it is not an emotional market that is buying but a market that knows what it wants to buy and rejects the rest. It is a conviction in the future value of Bitcoin.
BTC/USD 240 Min
Bitcoin is trading above $8,000 at the European opening, something that hasn't happened since May 22nd. The level requires consolation so it is now possible for Bitcoin to move in a narrow range, at least during the first half of the session.
Above the current price, the next target for the BTC/USD is $8,200, a price where we see a congestion of resistance lines that was generated in the downtrend. In the article written using our Confluence Indicator, it was clear that Bitcoin has little resistance to the $8.594 resistance level, the maximum of a failed bullish attempt in mid-May, the price level where the BTC/USD will also meet the monthly R2 level of Pivot Point.
Below the current price, the first support for Bitcoin is at a price level of $7,730. In this range, the BTC/USD has been consolidating its price level for much of yesterday's trading. The next support for the BTC/USD is at $7,600 although this is less solid. Finally, the next consolidation zone is at $7,400 and that would coincide with the EMA50 at 240 min, which would provide a significant cushion to sustain the price.
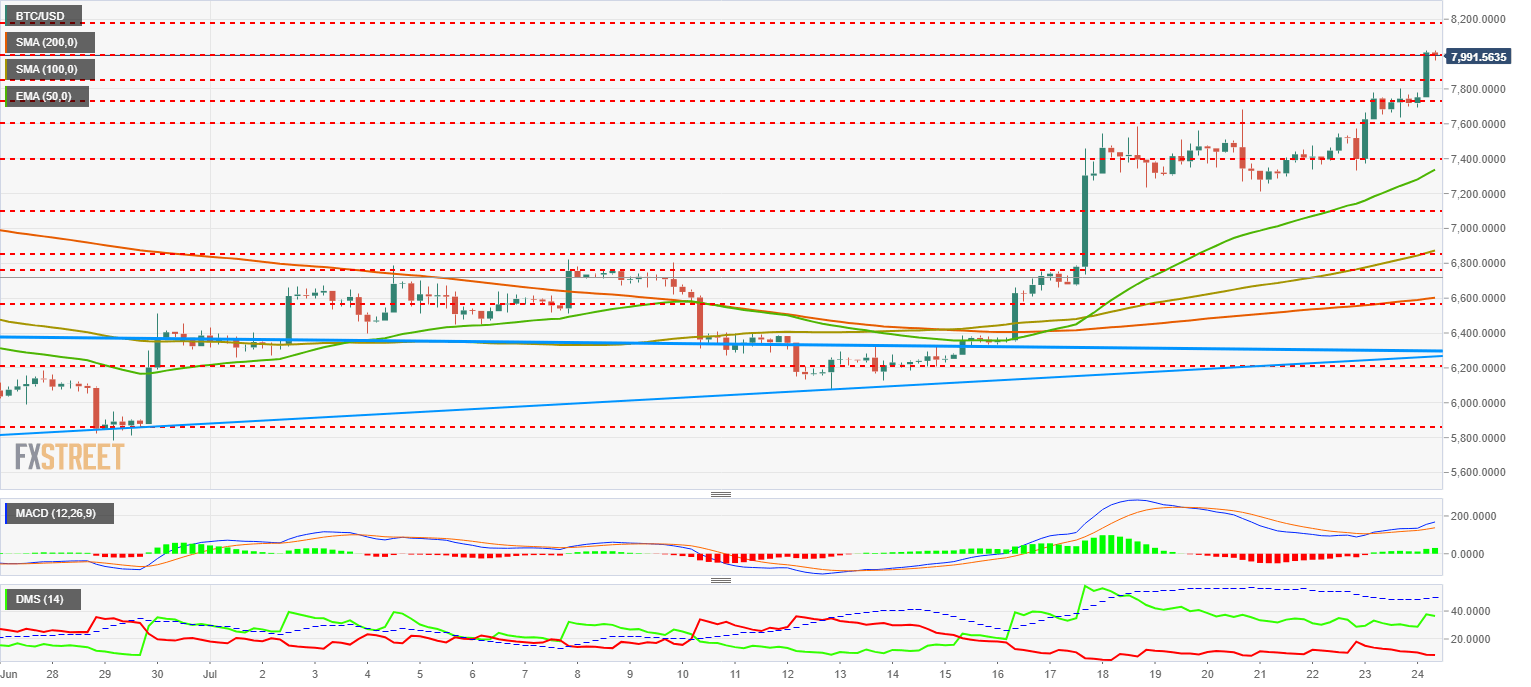
The 240-minute MACD does not show how the price averages become faster and leave room for Bitcoin to continue its bullish trend in the coming sessions.
The Directional Movement Index at 240 min shows us how buyers trust the movement and increase their activity while sellers withdraw strongly and do not take advantage of the rise to increase positions. The ADX above 49 points supports the continuation of the trend.
ETH/USD 240 Min
Ethereum is close to revealing where his next moves will go. The ETH/USD is currently trading at $469 and is still very much in line with the slightly bullish trend that began on April 6th. The options are very open and both sellers and buyers are waiting for any sign that clarifies the development for the next sessions. Ethereum is above its moving average at 240 min, a position it hasn’t enjoyed since last July 19th, which makes me opt for a possible bullish stretch.
Above the current price, the first resistance level for ETH/USD at $484 with a possible extension to $500. Above this level, the next resistance level for price congestion at $520. If it exceeds this level, Ethereum should be on its way to the main price target at $620/$630, overcome the price congestion resistance at $567.
Below the current price the only level to watch closely is at the trendline already mentioned. If Ethereum were to lose this level, which currently stands at $435, it would open up a fully bearish scenario that could bring good returns. The scenario would change to a strong bearish one and should be reanalyzed, but the first targets would be the supports at $420 and then $380.
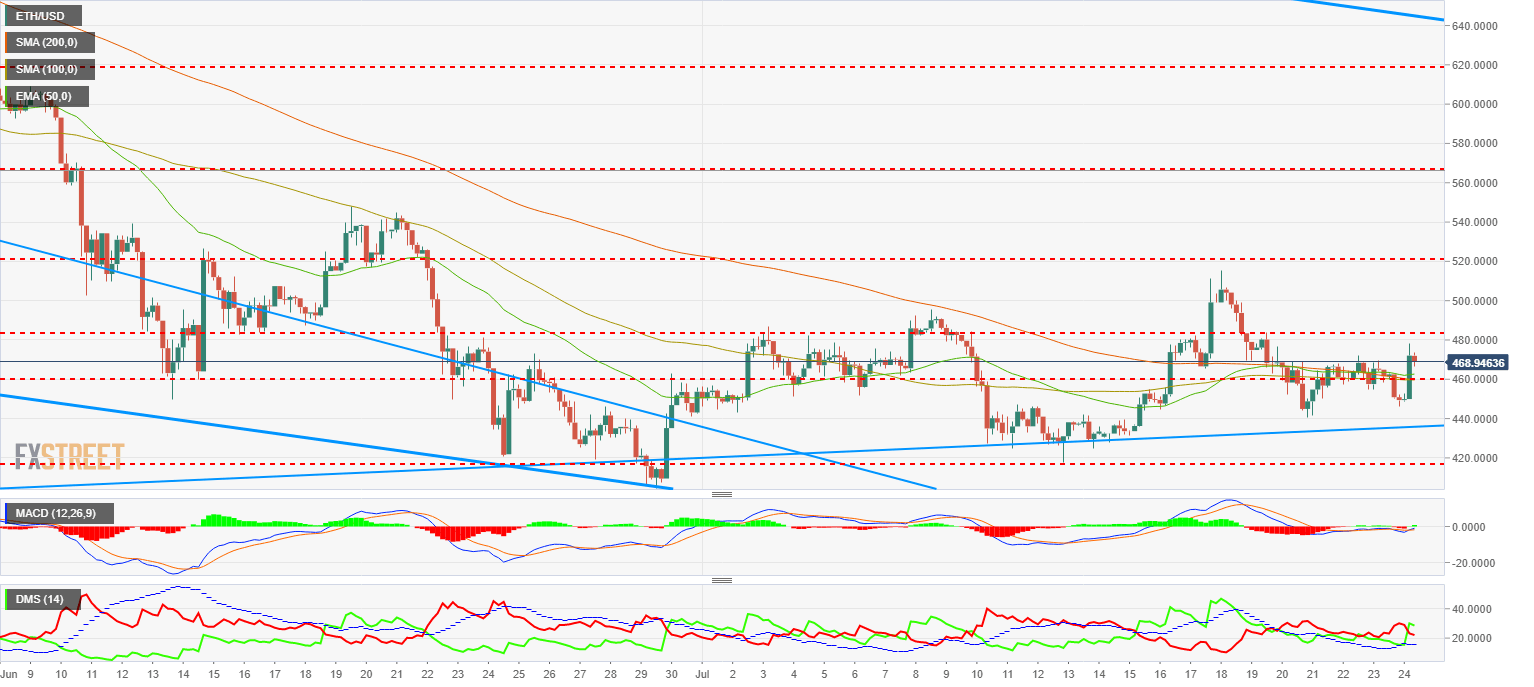
The MACD at 240 min is crossed upwards but below the zero line. This is the key point for Ethereum. If it can get above and into positive territory, Ethereum can start to rocket higher and following the dust left by Bitcoin in its surge.
The Directional Movement Index at 240 min shows buyers are trying to take control of the situation. The ADX has reacted to the late-breaking bullish move but remains below level 20, which indicates the existence of a trend force.
XRP/USD 240 Min
Ripple, on the other hand, does not react and continues to fall below its moving averages in 240 minutes after several days of moving in a narrow price range. Ripple is special, as it is the leading Crypto representative in the Equity segment. I am sure that this will make it develop in different ways to those of Bitcoin and Ethereum, but that it will end up giving joys and benefits to its owners.
In addition to the current price, the main objective for the XRP/USD is to exceed the moving averages, which requires it to reach $0.47. If you manage to reach this price level, the second target is at $0.50 and the third target awaits at $0.54. The final target for the tranche would be around $0.57.
Below the current price, life support for Ripple at $0.40. Below this price level, the XRP/USD would provide a fantastic opportunity to trade lower with a target of $0.25.
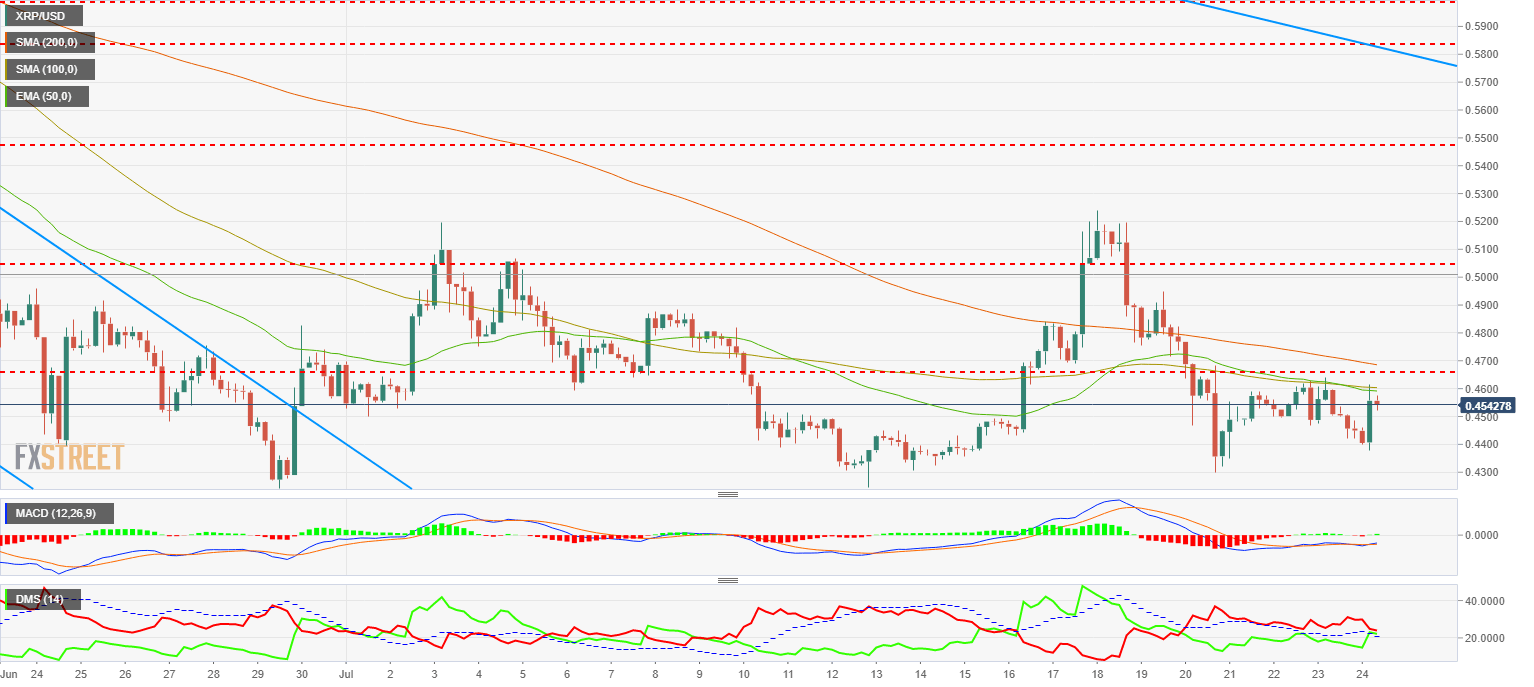
The MACD at 240 min shows a favorable upward profile for the Ripple, although it remains in a negative zone and well away from the indicator's balance line.
The Directional Movement Index at 240 min shows sellers ahead of buyers, though very close. Both move above level 20, so any reaction would be quite quick. The ADX is moving downward in face of market indecision.
Author

Tomas Salles
FXStreet
Tomàs Sallés was born in Barcelona in 1972, he is a certified technical analyst after having completing specialized courses in Spain and Switzerland. He expanded his technical training following the guidance of great experts on the financial markets.




