Top 3 Price Prediction: Bitcoin, Ethereum, Ripple – BTC recovers from support, ETH and XRP eyes bullish breakout
- Bitcoin price extends its recovery on Friday after finding support around the key level earlier this week.
- Ethereum nears the 23.6% Fibonacci retracement level at $2,138, a close above would suggest an upside move.
- XRP approaches the upper boundary of its falling channel, signaling a potential bullish breakout.

Bitcoin (BTC), Ethereum (ETH), and Ripple (XRP) extend their recovery on Friday after recent corrective moves. BTC is trading above $77,700 after finding support around major levels, and ETH is near the key resistance zone, where a breakout could trigger further rebounds. Meanwhile, XRP approaches its upper boundary of the falling channel; a close above signals a bullish move.
Bitcoin's major support holds strong
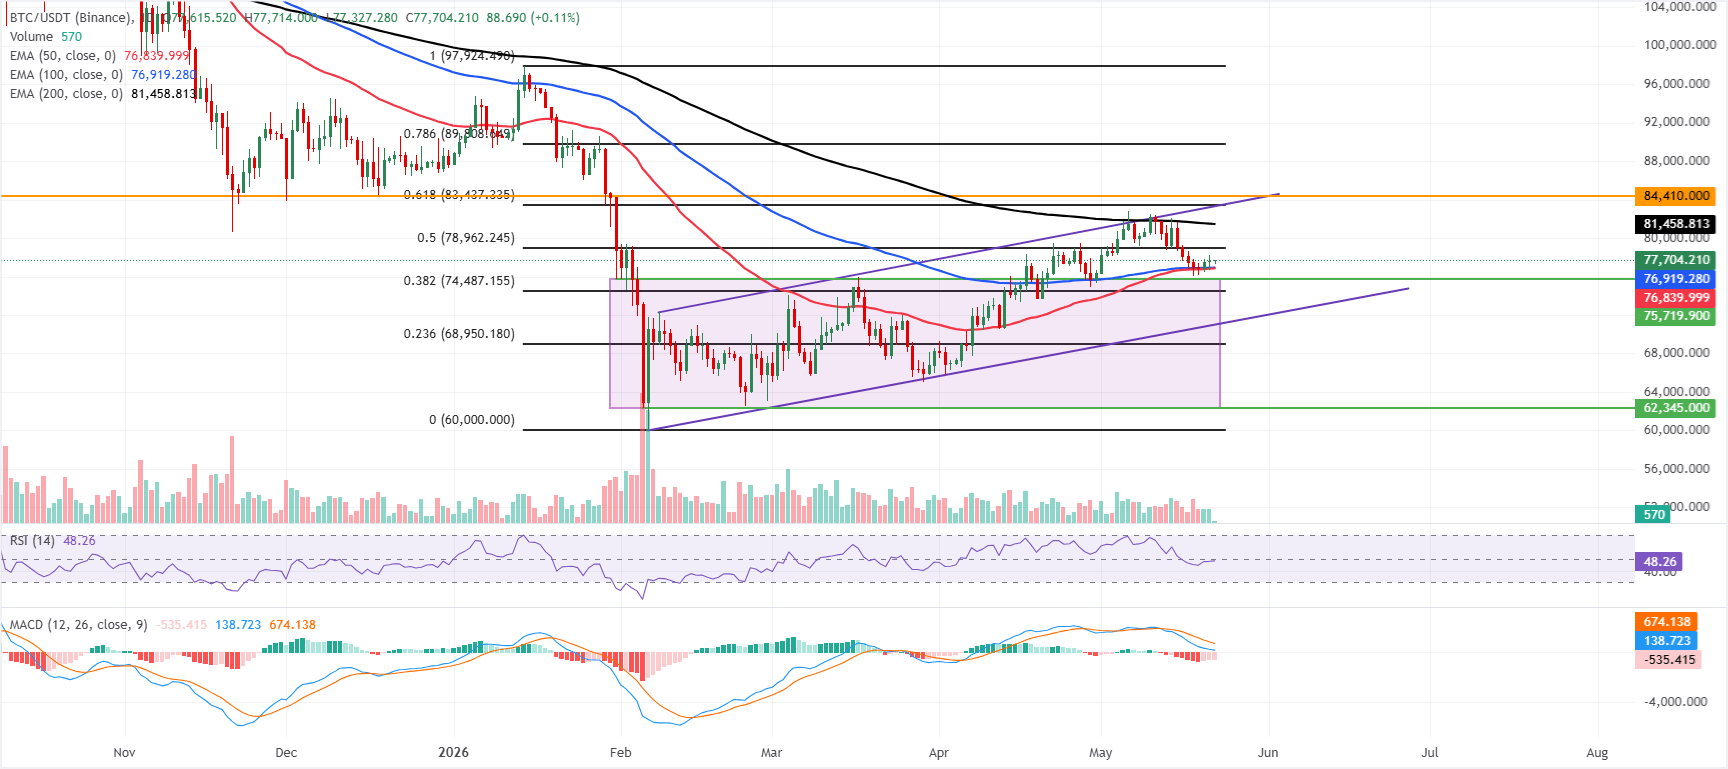
Bitcoin price extends its recovery, trading above $77,704 and holding above the 50- and 100-day Exponential Moving Averages (EMAs) near $76,840–$76,920, suggesting underlying dip-buying interest despite a dense topside cap.
The Crypto King is still pinned below the 200-day EMA at $81,458 and the 50% Fibonacci retracement of the latest swing at $78,962, leaving the broader structure in consolidation rather than in a clear breakout phase. The Relative Strength Index (RSI) hovers just below the 50 mark, while the Moving Average Convergence Divergence (MACD) remains in negative territory, suggesting that momentum is subdued and rallies could face selling pressure into overhead levels.
On the topside, initial resistance is located at the 50% Fibonacci retracement at $78,962, followed by the 200-day EMA at $81,458; a sustained move above these would open the way toward the 61.8% retracement at $83,437 and the horizontal barrier around $84,410.
On the downside, immediate support comes from the cluster of the 100-day EMA at $76,919 and the 50-day EMA at $76,840, with the 38.2% Fibonacci retracement at $74,487 next in line if those levels give way. A deeper slide would expose the former trendline break area around $70,995 and the 23.6% retracement near $68,950, where stronger medium-term demand would be expected to emerge.
Ethereum tests key resistance
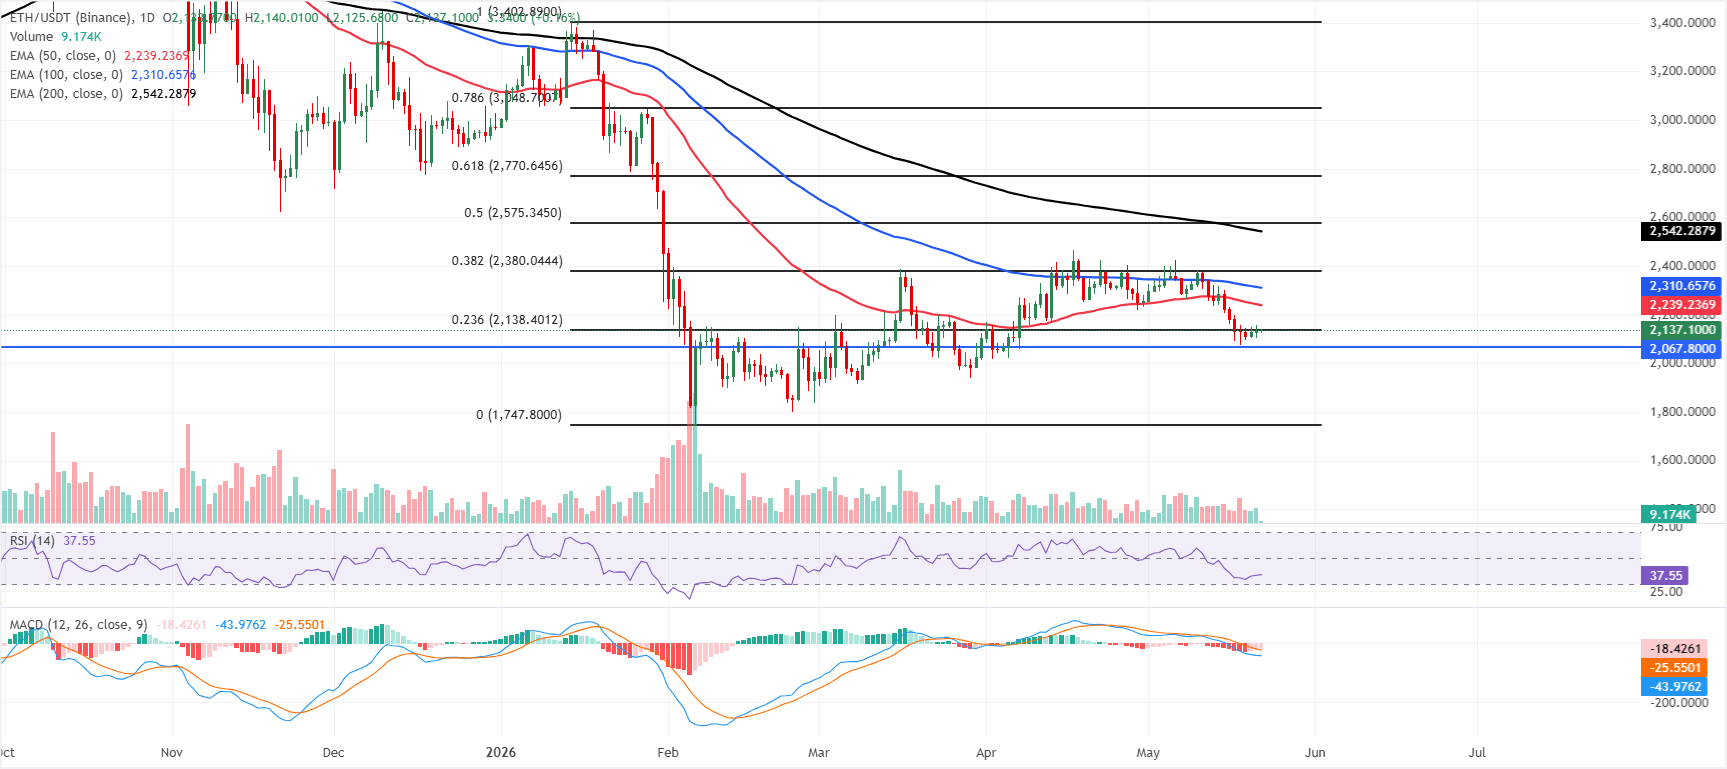
Ethereum trades at $2,137. Price remains below the 50-, 100-, and 200-day EMAs, which fan out well above the market and reinforce an overarching downtrend.
ETH is also capped almost immediately by the 23.6% Fibonacci retracement at roughly $2,138, underscoring the lack of topside traction after the recent slide. The RSI hovers just above 37, suggesting weak but not extreme downside pressure, while the negative MACD still hints at prevailing bearish momentum, though it has moderated from prior extremes.
On the upside, initial resistance is at the 23.6% Fibonacci retracement near $2,138, with further hurdles at the 50-day EMA near $2,239 and the 100-day EMA near $2,310. Above these, the 38.2% retracement near $2,380 and the distant 200-day EMA near the $2,542 mark are progressively stronger supply zones within the broader corrective structure.
On the downside, immediate support is seen at the horizontal level around $2,067, ahead of the more distant cycle low anchor near $1,748; a clear break under the former would likely expose the latter and extend the current bearish phase.
XRP could extend gains if it breaks above the channel pattern
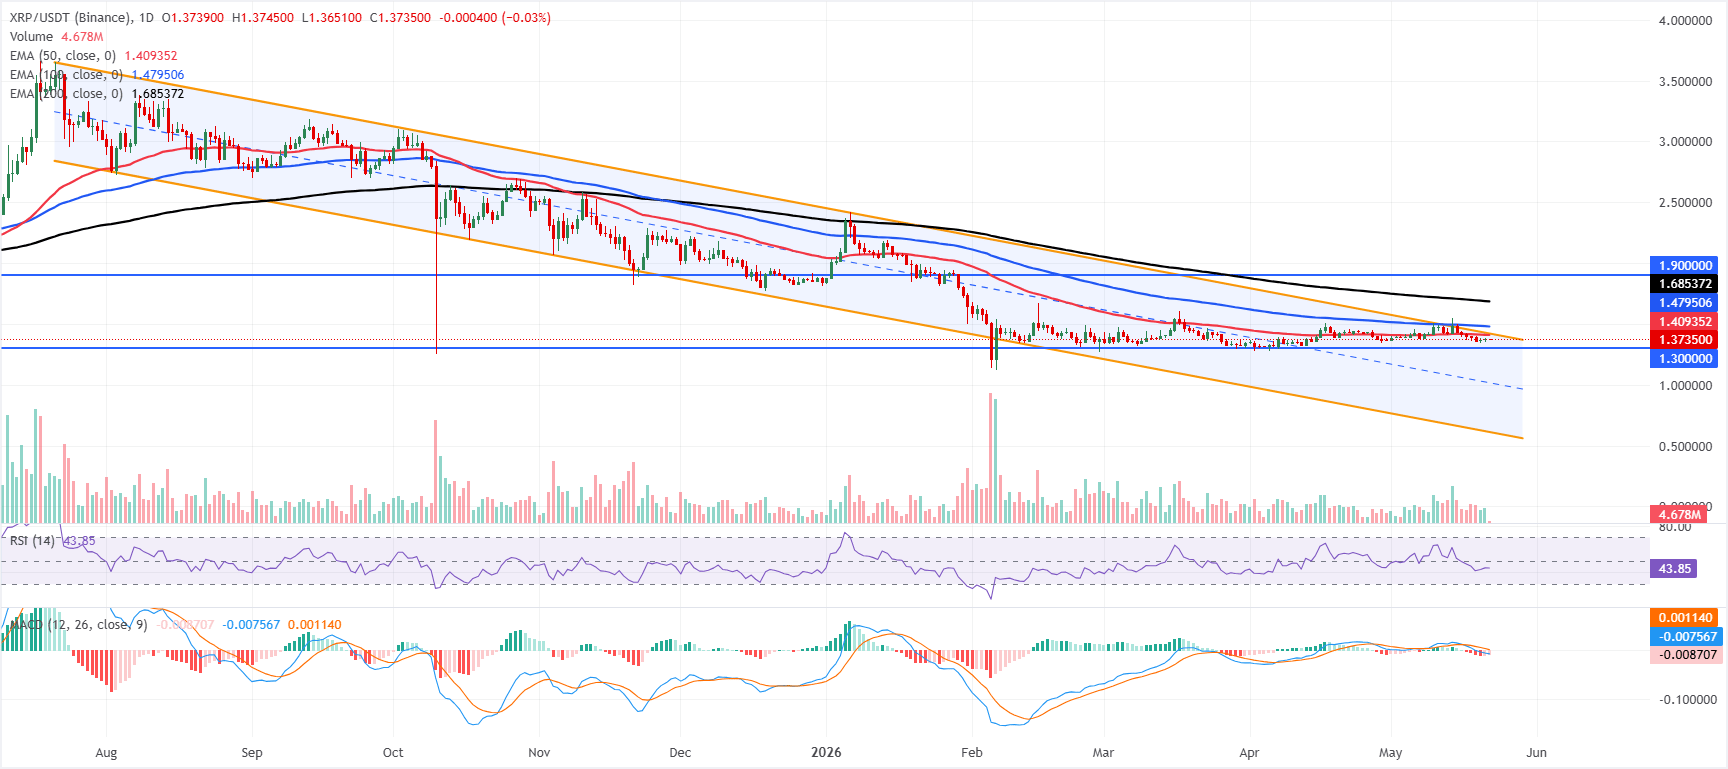
XRP price trades at $1.373, maintaining a bearish near-term bias as it holds below a stack of EMAs. The 50-day EMA at $1.409 is the first cap, reinforced by the upper boundary of the prevailing downward channel near $1.420, while the 100-day and 200-day EMAs at $1.479 and $1.685 sit higher and underscore a broader corrective phase.
Momentum backs this downward tone, with the RSI hovering around 43 in negative territory and the MACD below zero, hinting that rallies are likely to face selling pressure.
On the topside, immediate resistance is located at the 50-day EMA around $1.409, followed by the channel boundary near $1.420; a daily close above this area would be needed to ease the current pressure and expose the 100-day EMA at $1.479, ahead of the more distant 200-day EMA near $1.685 and the horizontal barrier at $1.900.
On the downside, initial support is seen at the horizontal level of $1.300, where a break lower would signal a continuation of the decline and open the door to deeper losses within the broader downtrend channel.
(The technical analysis of this story was written with the help of an AI tool.)
Cryptocurrency metrics FAQs
The developer or creator of each cryptocurrency decides on the total number of tokens that can be minted or issued. Only a certain number of these assets can be minted by mining, staking or other mechanisms. This is defined by the algorithm of the underlying blockchain technology. On the other hand, circulating supply can also be decreased via actions such as burning tokens, or mistakenly sending assets to addresses of other incompatible blockchains.
Market capitalization is the result of multiplying the circulating supply of a certain asset by the asset’s current market value.
Trading volume refers to the total number of tokens for a specific asset that has been transacted or exchanged between buyers and sellers within set trading hours, for example, 24 hours. It is used to gauge market sentiment, this metric combines all volumes on centralized exchanges and decentralized exchanges. Increasing trading volume often denotes the demand for a certain asset as more people are buying and selling the cryptocurrency.
Funding rates are a concept designed to encourage traders to take positions and ensure perpetual contract prices match spot markets. It defines a mechanism by exchanges to ensure that future prices and index prices periodic payments regularly converge. When the funding rate is positive, the price of the perpetual contract is higher than the mark price. This means traders who are bullish and have opened long positions pay traders who are in short positions. On the other hand, a negative funding rate means perpetual prices are below the mark price, and hence traders with short positions pay traders who have opened long positions.
Author

Manish Chhetri
FXStreet
Manish Chhetri is a crypto specialist with over four years of experience in the cryptocurrency industry.