AI Tokens Price Prediction: Capital rotation fuels FET, VIRTUAL, and NEAR rallies
- Artificial Superintelligence Alliance extends gains on Monday, following a 12% jump the previous day.
- Virtuals Protocol hovers above $0.870, marking its third consecutive day of over 4% gains.
- NEAR Protocol is up 5%, extending a steady near-term recovery phase over the last three days.

AI tokens, including Artificial Superintelligence Alliance (FET), Virtuals Protocol (VIRTUAL), and NEAR Protocol (NEAR), are leading gains over the last 24 hours. This suggests a rotation of capital from previously favored DeFi tokens into AI tokens. The technical outlook for FET, VIRTUAL, and NEAR indicates an upside bias as momentum strengthens.
FET rally surpasses $0.25
FET token trades around $0.2600 at press time on Monday, extending gains after a 12% rally the previous day. The AI token keeps a bullish near‑term bias, with the third consecutive day of trading in the green.
FET holds well above the 50‑, 100‑, and 200‑day Exponential Moving Averages (EMAs) at roughly $0.1927, $0.1834, and $0.2036, respectively, suggesting a trend reversal. The 50- and 200-day EMAs are on the verge of a Golden Cross, which could confirm a bullish shift in the long-term trend.
From a technical perspective, FET tests the bullish breakout of the 78.6% Fibonacci retracement at $0.2525, measured from $0.2889 to $0.1192. A confirmed breakout above this level could target the $0.2889 swing high, followed by the 127.2% and 161.8% Fibonacci extension levels at $0.3350 and $0.3937, respectively.
Momentum on the daily chart suggests that buyers remain in control, while the Relative Strength Index (RSI) near 69 and a positive Moving Average Convergence Divergence (MACD) line bouncing off its signal line hint at strong but increasingly stretched upside momentum.
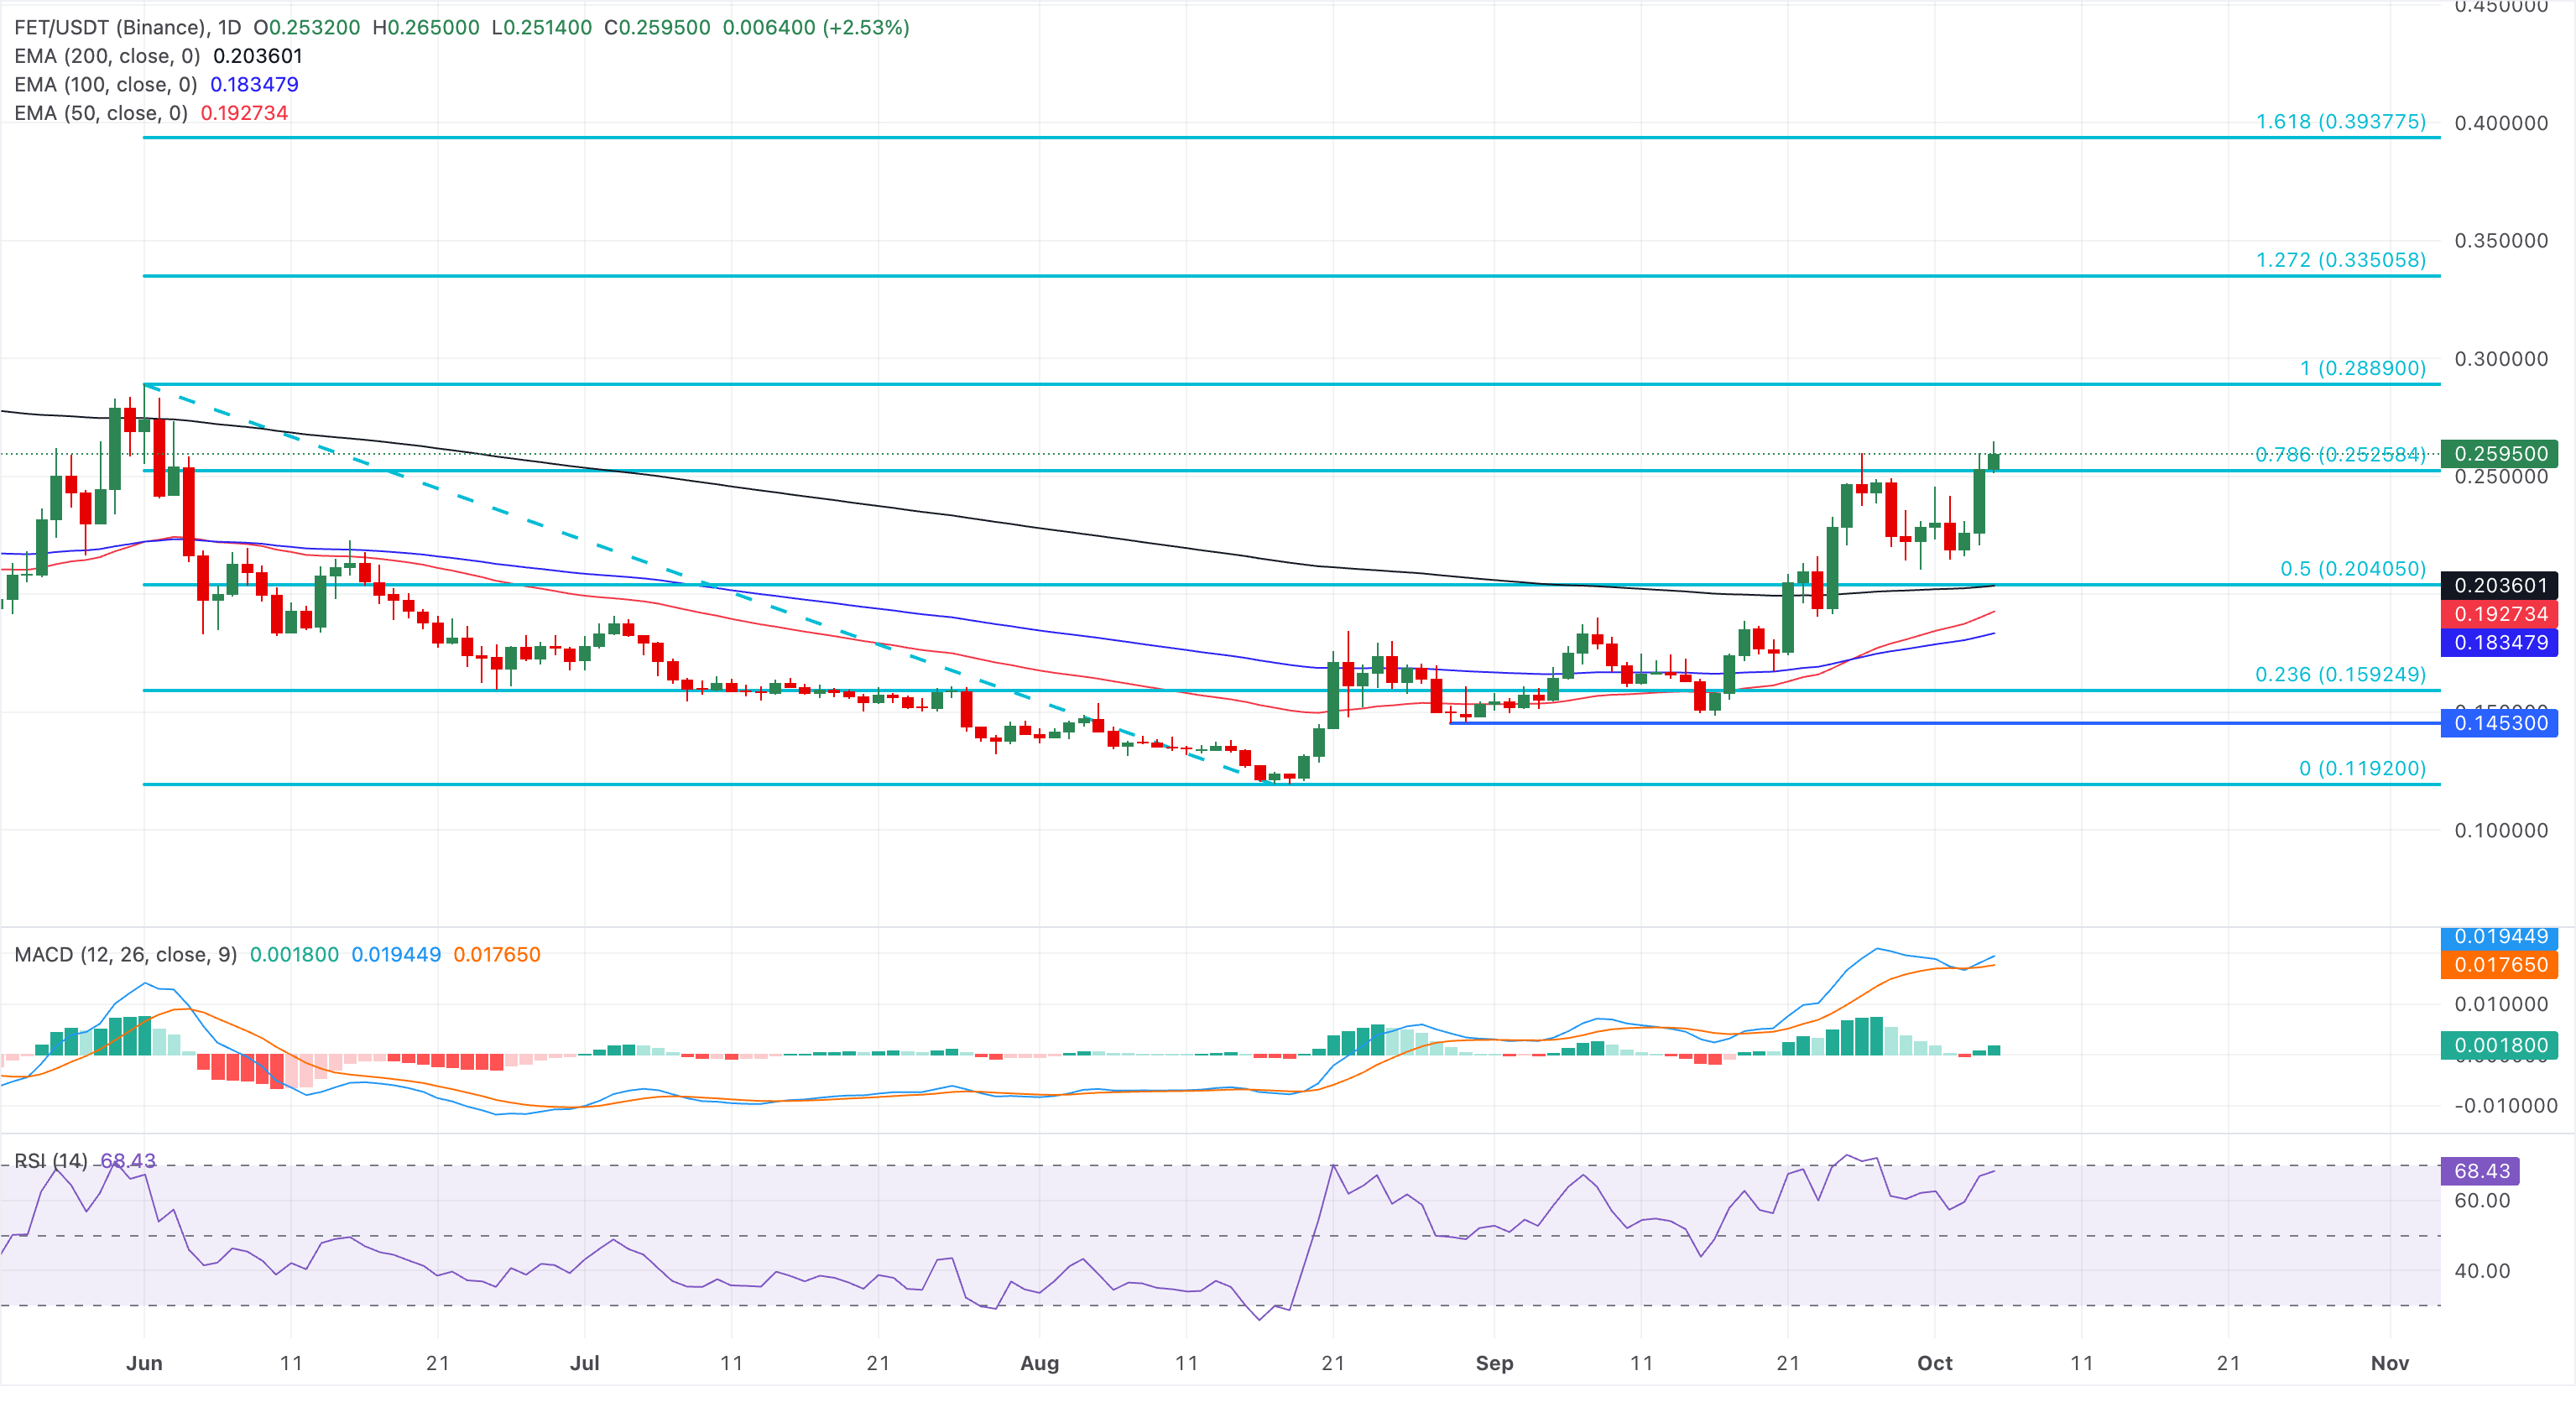
On the downside, initial support is at the 50% retracement level of $0.2040, where the 200‑day EMA at $0.2036 reinforces the area. Deeper declines would expose the 50‑day EMA at $0.1927 and the 100‑day EMA at $0.1834.
Virtuals Protocol nears key resistance level breakout
Virtuals Protocol is up 4% on Monday, extending gains for the third consecutive day. The AI token extends its advance well above the 50-day EMA at $0.7113, the 100-day EMA at $0.6798, and the 200-day EMA at $0.7025, reinforcing a constructive near-term bias. A Golden Cross between the 50- and 200-day EMAs suggests a steady recovery leading to a long-term bullish trend reversal.
Momentum also supports the upside, with the RSI hovering near 66 and the MACD line holding above its signal line, suggesting that bullish pressure remains intact.
The immediate resistance for VIRTUAL aligns with the October 13 high at $0.8795. A confirmed breakout above this level could open the path toward the $1.0000 psychological level, followed by the September 15, 2025 high around $1.1821.
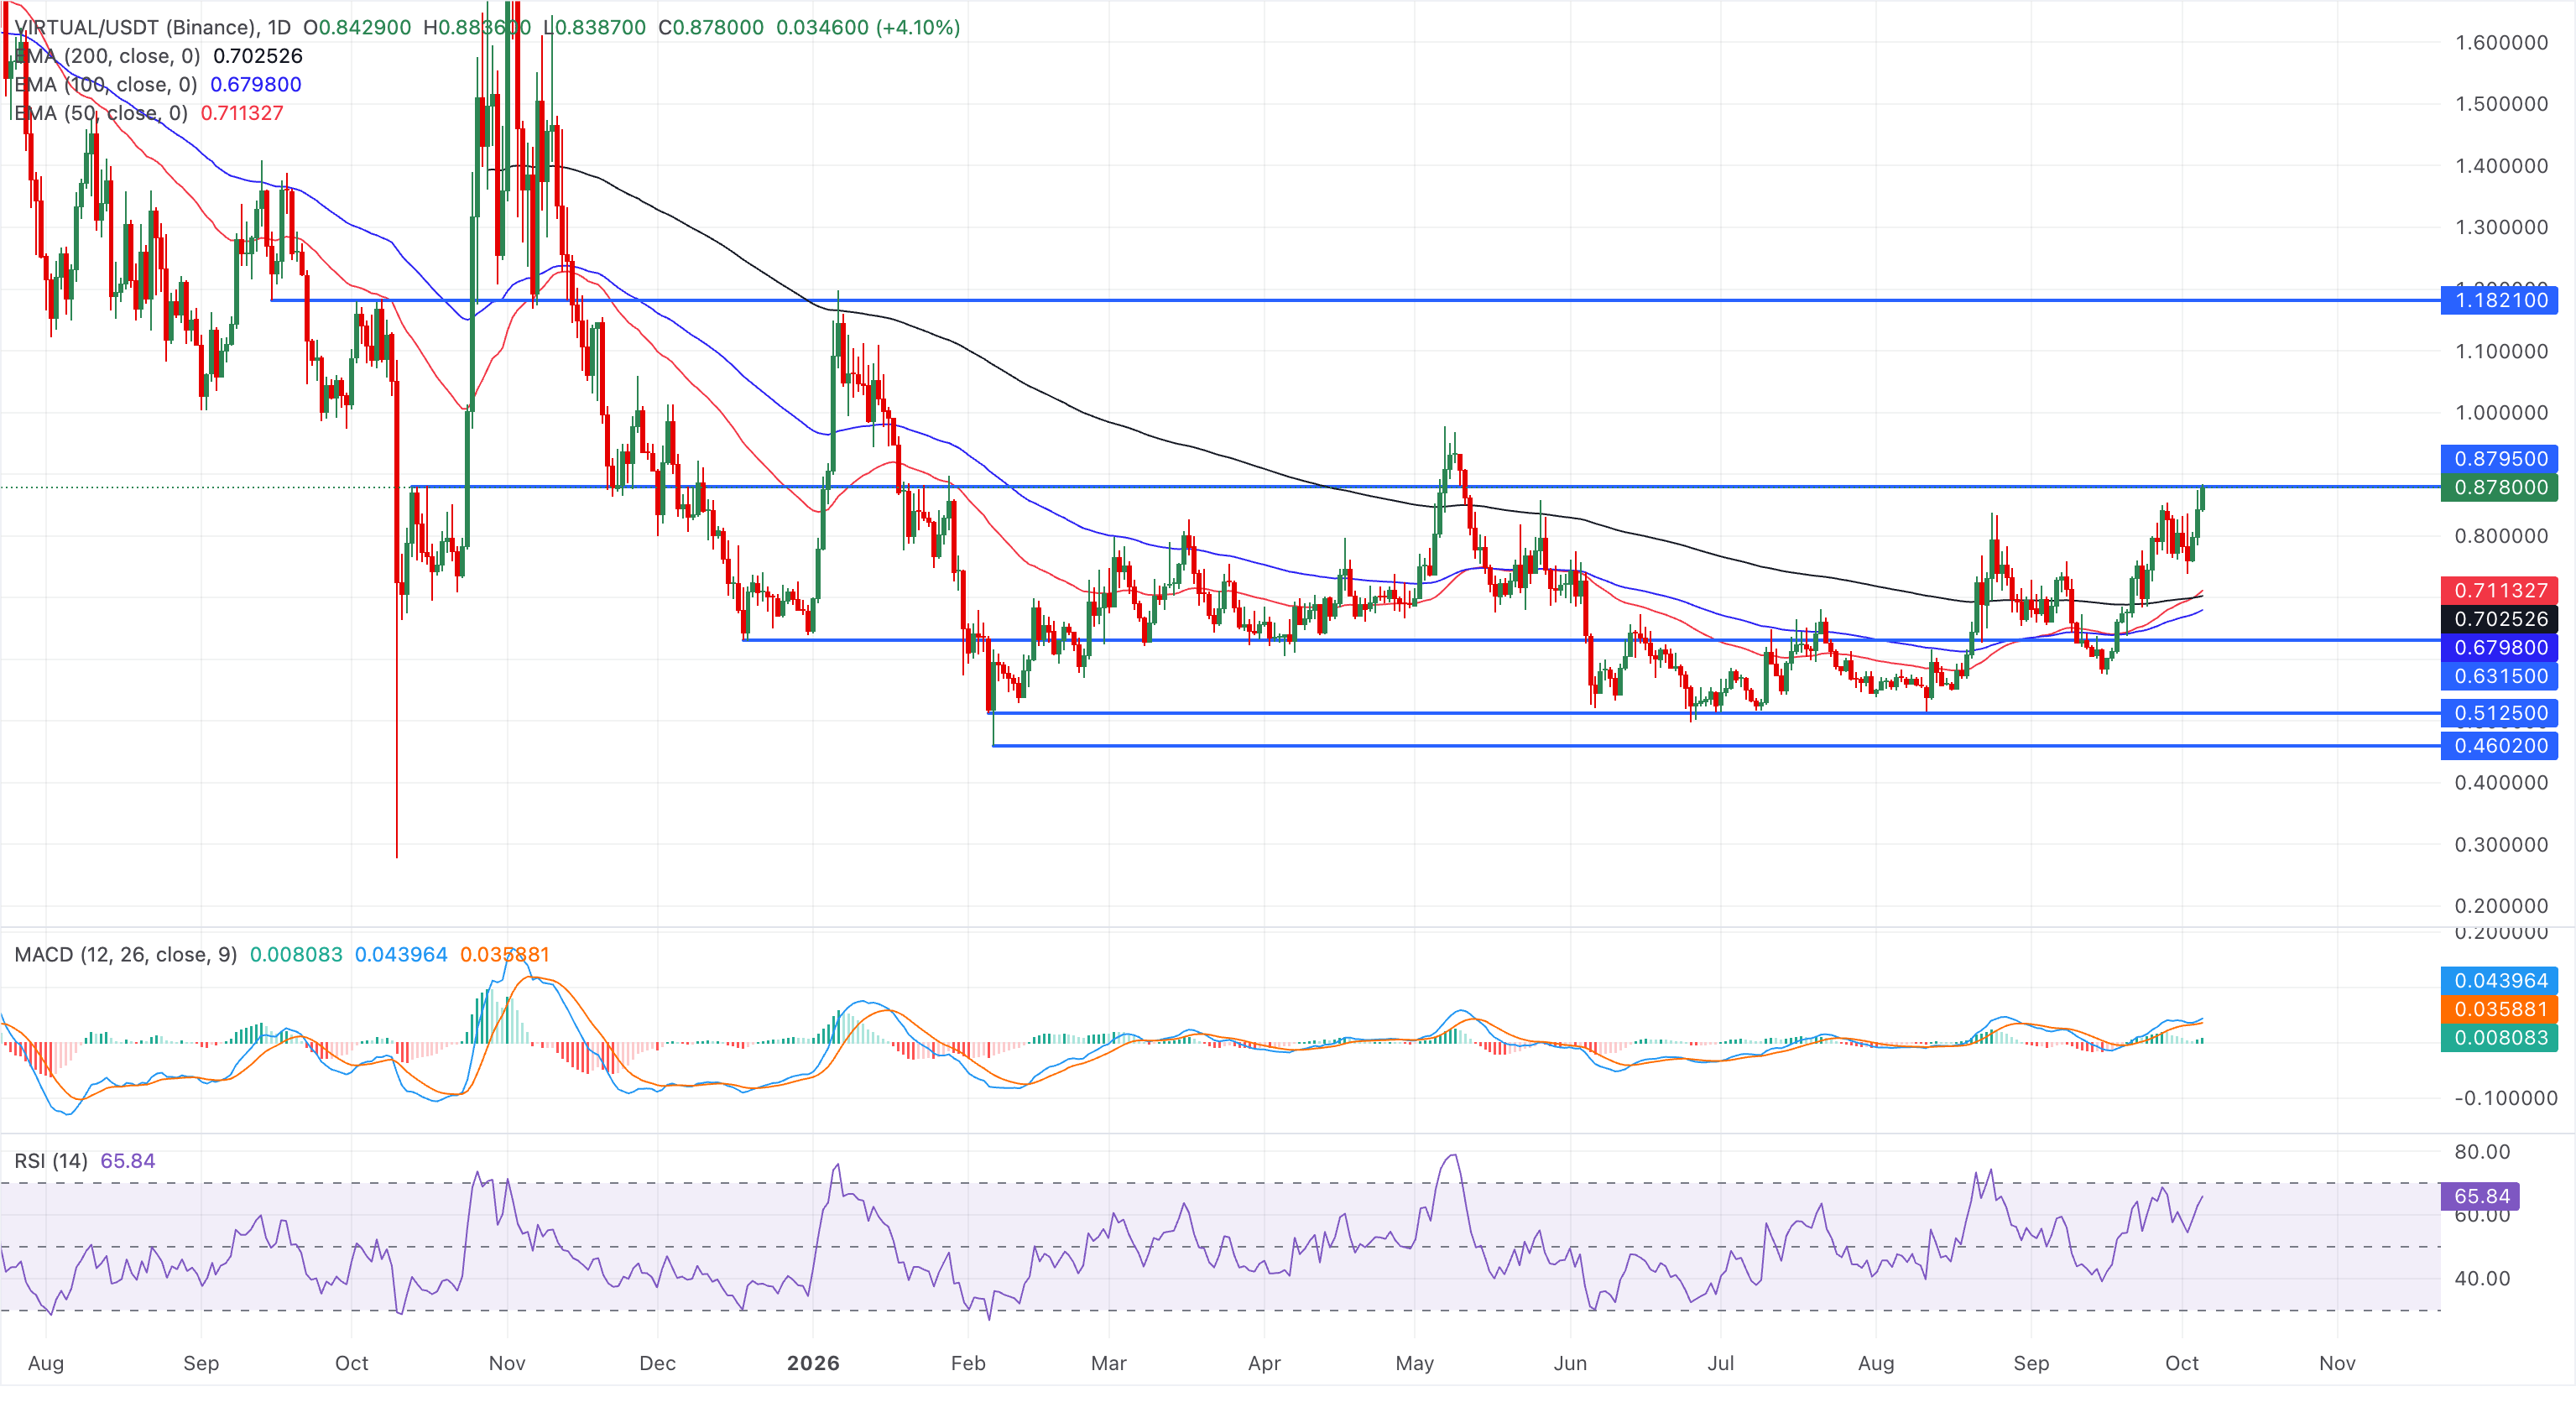
On the downside, initial support is seen at the 50-day EMA at $0.7113, ahead of a deeper technical floor clustered around the 200-day EMA at $0.7025 and the 100-day EMA at $0.6798.
NEAR Protocol recovery gains momentum
NEAR trades well above $5.00 at press time on Monday, maintaining a bullish near‑term bias after rallying over 175% in September. NEAR hovers well above the 50-period EMA at $4.83 on the four-hour chart, with the 100-period EMA at $4.48 and the 200-period EMA at $3.81, suggesting a well-supported uptrend structure.
The more recent rising support trendline near $4.7401 now serves as a reference zone. Looking up, the R1 Pivot Point at $5.4546 and the September 28 high at $5.5780 act as the overhead barrier. A confirmed breakout above this zone could target the R2 and R3 Pivot Points at $5.9923 and $6.4456, respectively, as the next bullish targets.
The MACD maintains a steady upward trend with an expanding histogram, while the RSI, around 62, reinforces positive momentum without indicating extreme overbought conditions.
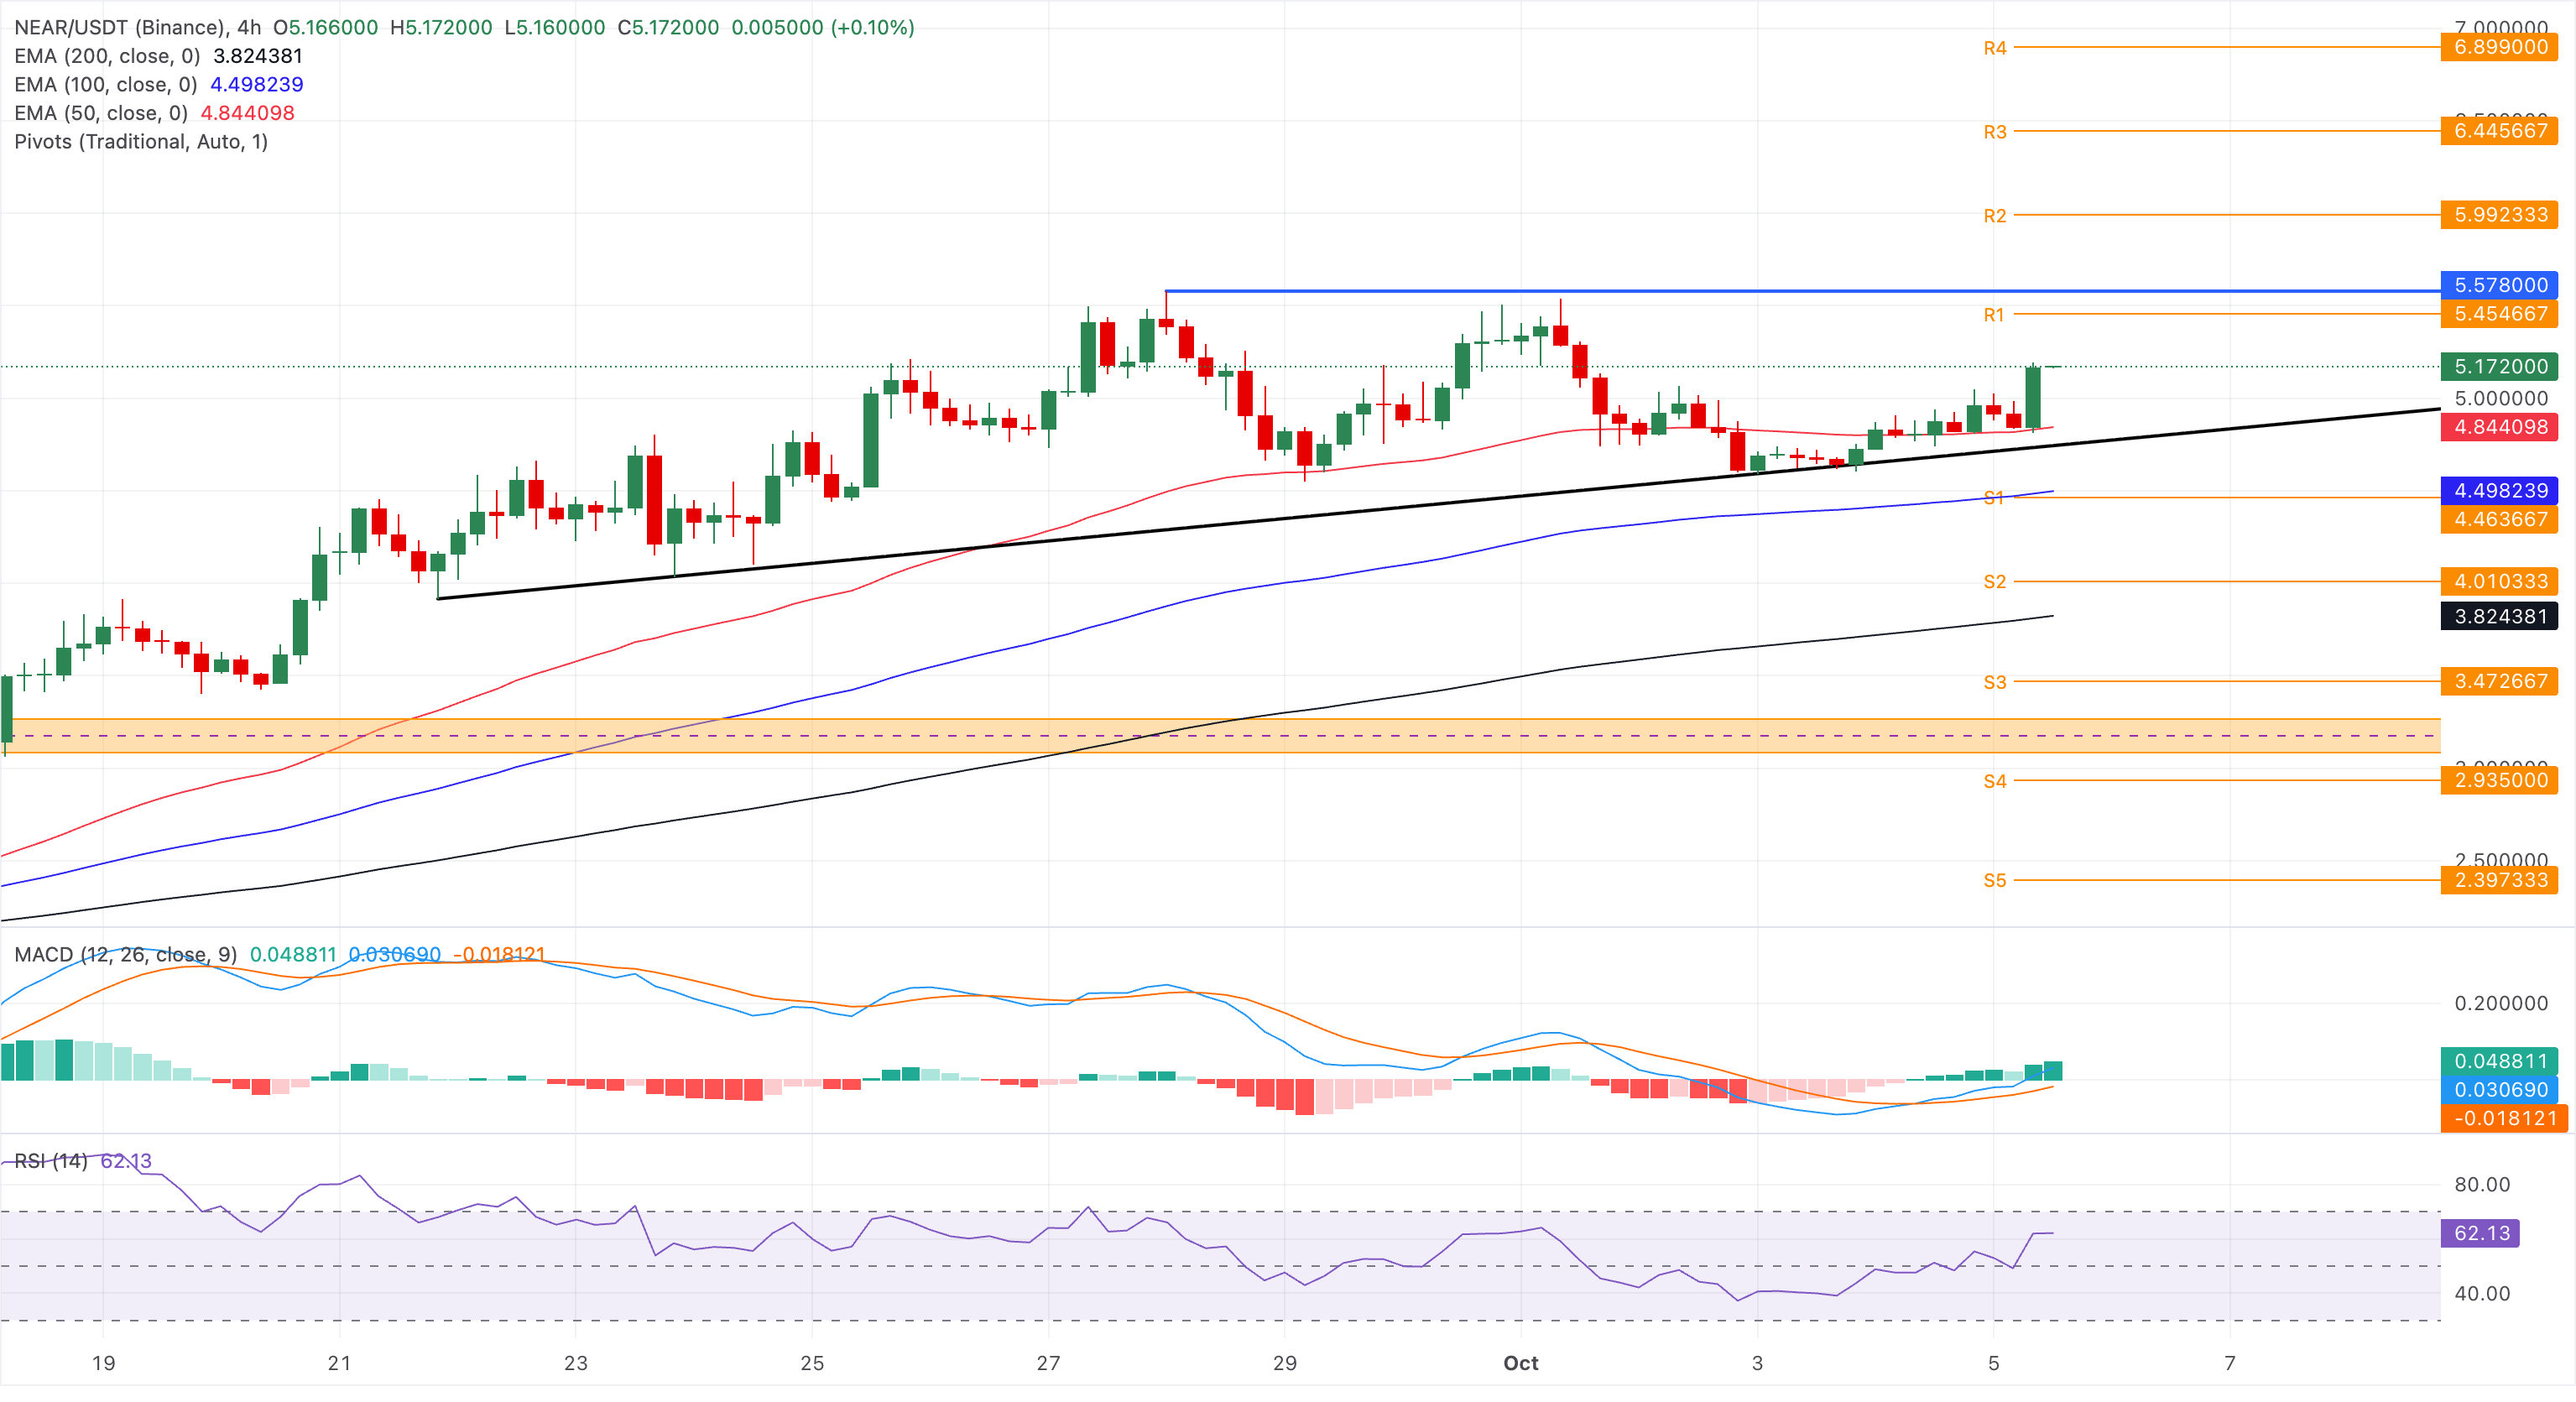
On the downside, initial support is seen at the 50-period EMA at $4.8440, followed by the rising support trendline around $4.7401. Below these, the 100-period EMA at $4.4982 and the 200-period EMA at $3.8243 mark deeper structural floors for any extended correction.
(The technical analysis of this story was written with the help of an AI tool. Know more.)
Author

Vishal Dixit
FXStreet
Vishal Dixit holds a B.Sc. in Chemistry from Wilson College but found his true calling in the world of crypto.