Top 3 Price Prediction Bitcoin, Ethereum, Ripple: A compressed market is desperately searching for space
- BTC/USD fails to gain traction and can provide relief to Ethereum.
- ETH/USD is just a few cents away from beating the SMA200 and capturing clean ground.
- XRP/USD relaxes and is in danger of enjoying its technical advantage too much.

As if time had stood still, the main protagonists of the Crypto board are today in the same price ranges in which they have been confined for several days or as in the case of Bitcoin, weeks.
Volatility continues to plummet and has reached levels not seen since the beginning of 2017. This can take a long time. If we look at long-term volatility indicators, we can see how the great rise in volatility at the beginning of 2018 is still being regulated.
Without a catalyst that gives a motive and a direction to the Crypto market, it can be quite complicated for large price movements to start in the short term.
BTC/USD 240-Min
The BTC/USD is currently trading at the $6,553 price level and continues to be locked into ever closer moving averages. At the current rate, the BTC/USD will run out of space by the end of the week and perhaps at that point the volatility needed to get this market going again will appear again.
Below the current price, the first support level for the BTC/USD is $6,528 where the SMA100 is located. Losing this level would be a sign of weakness in the short term, and could take the price of Bitcoin quickly to the next support level at $6,400. Within the current scenario, the BTC/USD could reach a third support level at $6,200 and nothing would change in the medium term. On the other hand, losing this last level of support would make it very difficult to see price increases for a long time.
Above the current price, the BTC/USD faces three obstacles in a very narrow price range. At the price level of $6,564 (EMA50), at $6.568 (price congestion resistance) and at $6,608 (SMA200). There is a lot at stake for the bullish side of the price in a very narrow range.
Above this confluence of resistances, the path to Bitcoin would become much easier, with a clear target of $6,760.
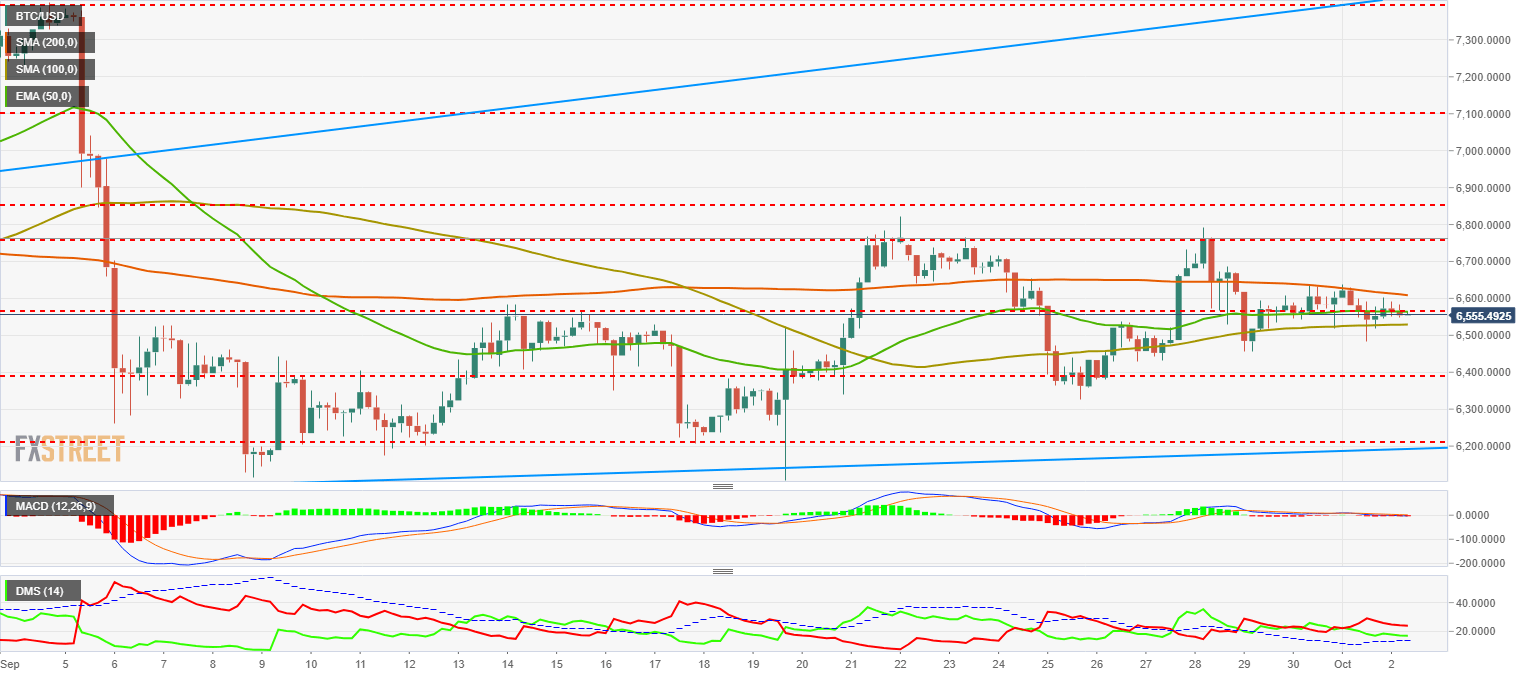
The MACD at 240-Min shows a very flat profile. It perfectly reflects the current situation of lack of direction and strength.
The DMI at 240-Min shows bears declining positions after yesterday's falls. The bulls don't see it clearly either and they also decrease their positions. Given the lack of clarity in the short term, they are leaving the market.
ETH/USD 240-Min
The ETH/USD is currently quoted at the price level of $229.4. As with the Bitcoin, Ether is also compressed between the classic moving averages. The difference between the ETH/USD and the BTC/USD is in the relative maximum line, which is descending in the Ether and totally horizontal in the BTC. This detail will greatly condition the way out of this structure for each of them.
Below the current price the ETH/USD has three levels of support in a very narrow range, starting with the first support at $226 (EMA50), and the next level of support at $223 where the SMA100 converges and a level of price congestion. Losing this level would send the Ether directly to the $195 price level and with many probabilities up to $170.
Above the current price, only the SMA200 at $229.9 separates the ETH/USD from the relative highs at $248, possibly a simple step on its path to $270. So, only 40 Cents separates the Ether from a bullish environment. If it fails to move higher, the message will be one of extreme weakness.
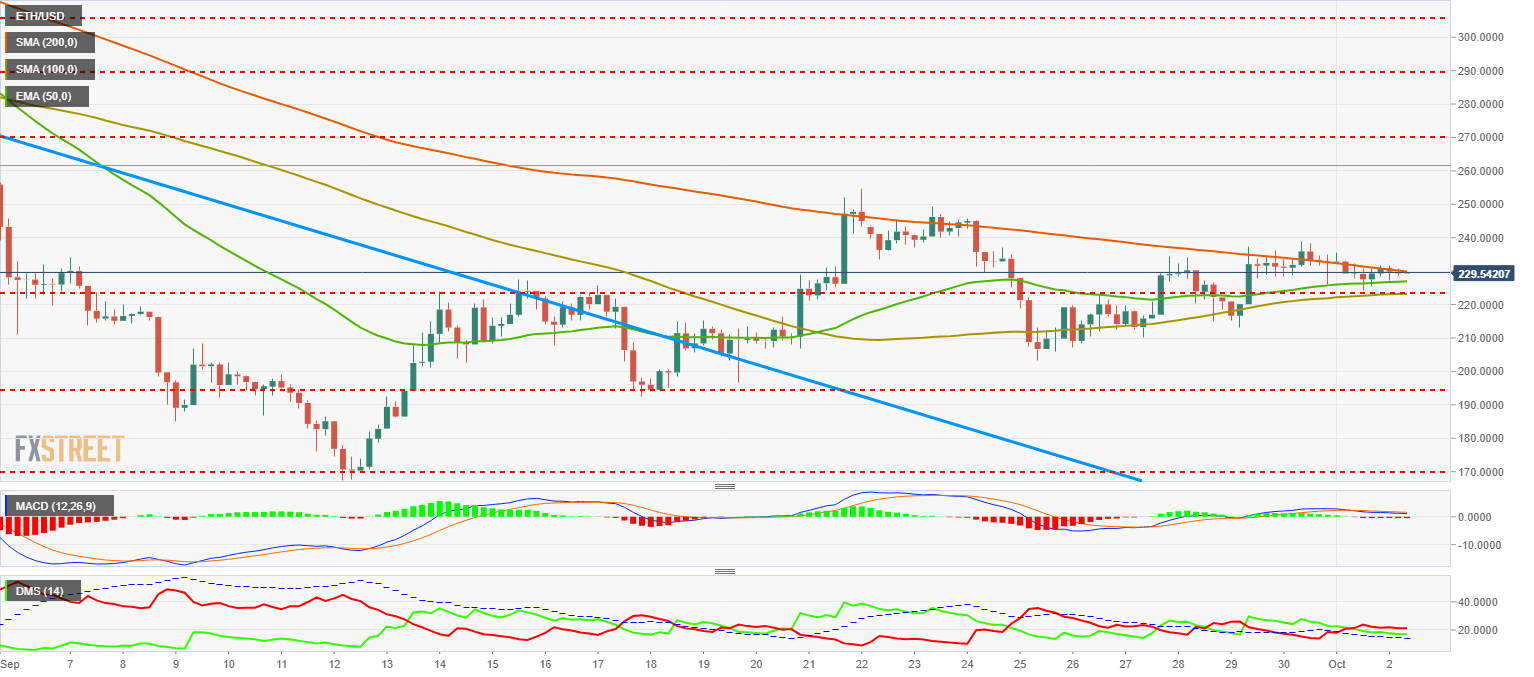
The MACD at 240-Min shows a very horizontal profile but with some difference from Bitcoin. In the case of Ethereum, we see how the averages have crossed, now increasing the possibilities of an upward crossing.
The DMI to 240-Min shows that the bears are at levels superior to the bulls although for very little. Both decrease positions but remain above an ADX that did not react to yesterday's bearish movements.
XRP/USD 240-Min
The story of the XRP/USD is different. It has done its job and got rid of the moving stockings. It copies the market situation and moves in the last few hours within a rather narrow range. However, especially on the bullish side, the situation is much simpler than of its peers. Ripple is currently trading at the $0.563 price level.
Below the current price, the first support is at $0.55 (price congestion support), a level that would be reinforced by the close presence of the EMA50 at $0.538. The next bearish target is $0.505 (price congestion support) as a step prior to the last support level within the current scenario at around $0.465.
Above the current price, the XRP/USD has no moving averages, so the price congestion resistance levels are now a benchmark. The first resistance is at the price level of $0.584, then $0.60 and $0.632.
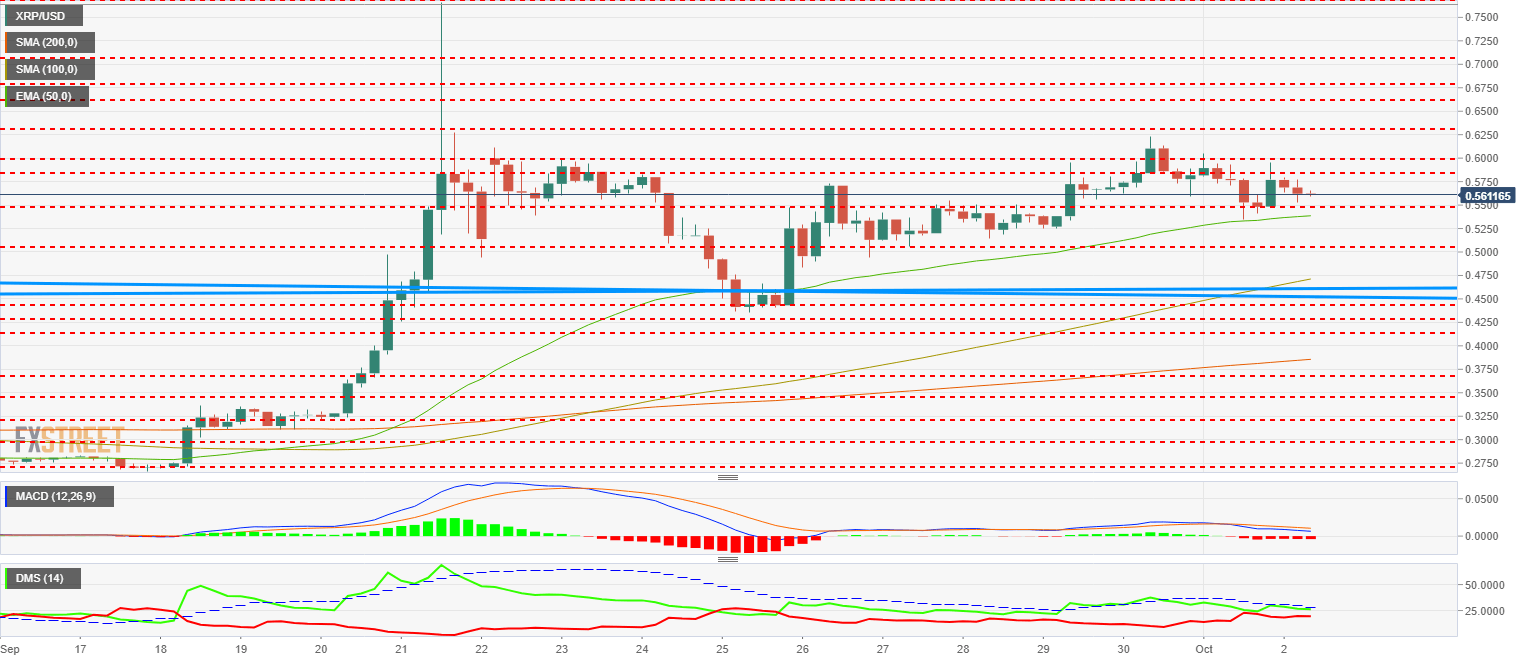
The MACD at 240-Min is crossed down but above the zero line. It continues to consolidate after last week's strong upside moves. We see some separation between lines, so any movement could crystallize in the short term trend.
The DMI at 240-Min shows bulls at levels higher than those recorded by bears, although the bears have been increasing positions in recent sessions. The ADX continues to decline but with a margin to react to the slightest opportunity.
Get 24/7 Crypto updates in our social media channels: Give us a follow at @FXSCrypto and our FXStreet Crypto Trading Telegram channel
Author

Tomas Salles
FXStreet
Tomàs Sallés was born in Barcelona in 1972, he is a certified technical analyst after having completing specialized courses in Spain and Switzerland. He expanded his technical training following the guidance of great experts on the financial markets.


