Top 3 Price Prediction Bitcoin, Ether, Ripple: Safe-haven role under construction
- The potential of the cryptocurrency ecosystem is still far from being a mass adoption option.
- Only the progressive deterioration of economies based on fiat currencies will accelerate adoption.
- The obstacles to mass adoption are legal and usability ones, concept and technology are not the problem.

A new day of home confinement in the fight against COVID-19 and a strange feeling of being Bill Murray in "Groundhog Day", the belief that time does not pass, that everything remains the same.
The Top 3 Cryptocurrencies seem to share this feeling and continue day after day in the price range where the March 12 crashes.
Enthusiasts of the financial blockchain ecosystem are in low spirits because the theoretical safe-haven role that Bitcoin was supposed to play has vanished.
But is there any basis for this disenchantment?
Of course, it is, but with nuances like:
- The selling seen in both Bitcoin and Ether and others are no different from those of gold, the ultimate safe-haven of present and past civilizations.
- Despite the constant increase in the social adoption of cryptocurrencies, accessing this market is not as easy as it should be to be a valid option in case of panic.
- Confidence in the current monetary system is low among experts. Still, among the average Joe, you don't hear much talk about the critical situation of public finances and the balance sheets of the major central banks.
The massive adoption of cryptocurrencies needs time, and this market has not yet reached the critical volume that makes them indispensable in daily life.
A regulatory framework would be needed to speed up this process, which for the time being, governments are reluctant to provide, a reasonable position as they usually defend the "status quo".
In addition to legal factors, it is necessary to improve the user experience, with developments similar to those recently implemented by Coinbase, which allow users to identify their wallets with a user name instead of an endless hexadecimal row.
The journey to the moon will be long, but it's still going on, at least that's what the technical analysis says.
ETH/BTC Daily Chart
The ETH/BTC pair trades at 0.0218 and finds support at the SMA100 as the consolidation pattern evolves from the bullish trend that began earlier this year.
Above the current price, the first resistance level is at 0.022, then the second at 0.023 and the third one at 0.025.
Below the current price, the first support level is at 0.0214, then the second at 0.0212 and the third one at 0.0208. Below the third support level, the consolidation scenario would change, and ETH/BTC would enter a medium-term sideways phase.
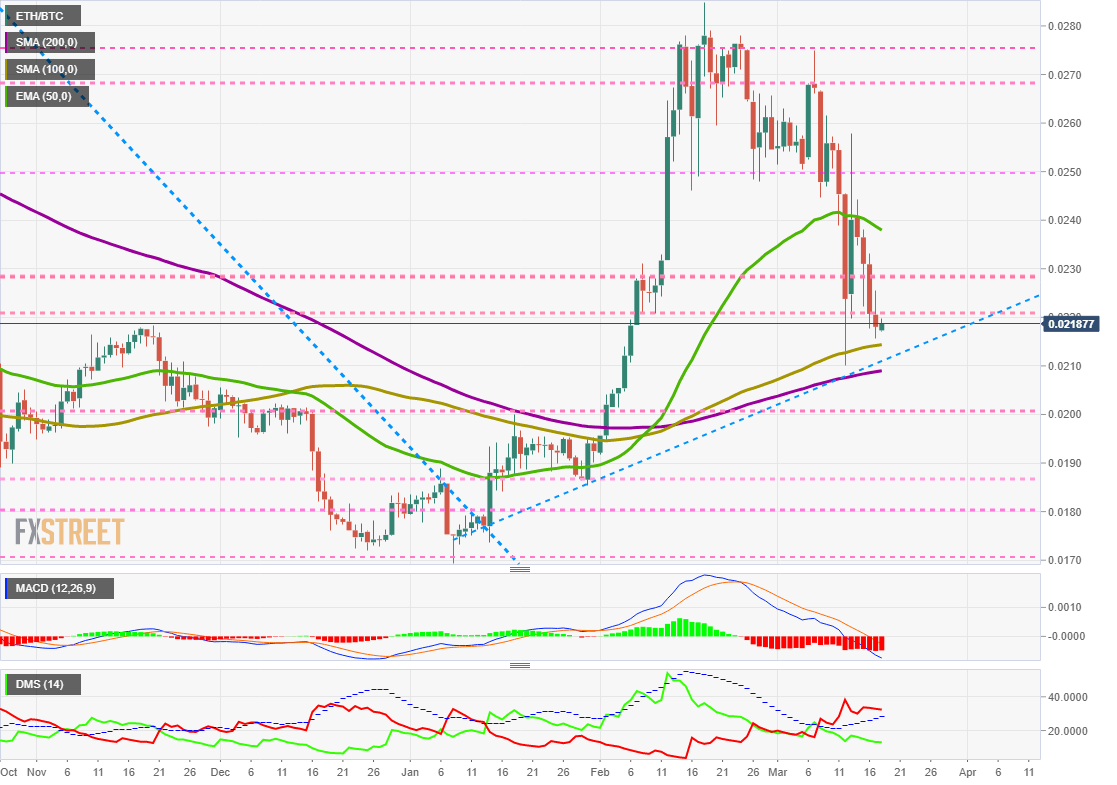
The MACD on the daily chart shows a continuation of the consolidation trend.
The DMI on the daily chart shows the bears controlling the ETH/BTC pair with enough of a lead to confirm that the downward consolidation movement continues.
BTC/USD Daily Chart
The BTC/USD pair is currently trading at the price level of $5132 and is still within the price range of the last few days. The current price zone coincides with the base of the long-term bearish channel.
Above the current price, the first resistance level is at $5500, then the second at $5850 and the third one at $6200.
Below the current price, the first support level is at $5100, then the second at $4900 and the third one at $4800.
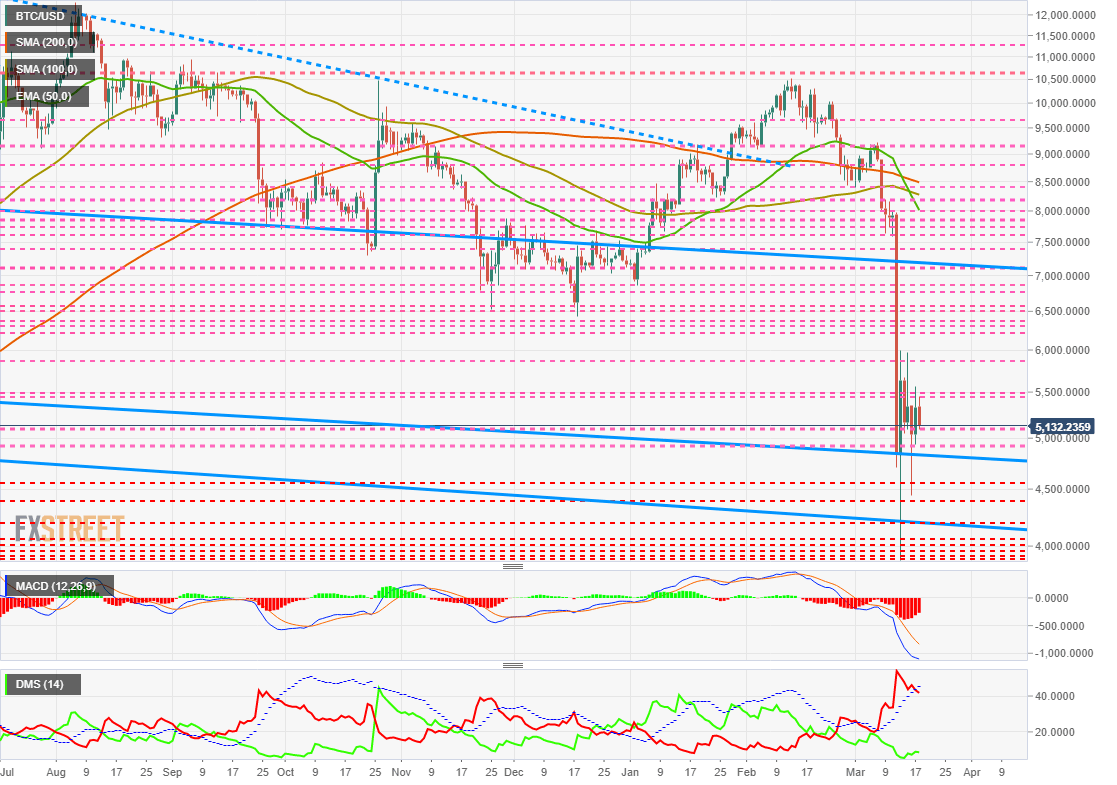
The DMI on the daily chart shows how bears lose support from the ADX line and deactivate the bearish pattern. This setup doesn't mean that there can't be more price declines, but in any case, they would be within a terminal process.
ETH/USD Daily Chart
ETH/USD is currently trading at $112.6 and continues to consolidate after the sell-off.
Above the current price, the first resistance level is at $115, then the second at $120 and the third one at $125.
Below the current price, the first support level is at $110, then the second at $105 and the third one at $103.
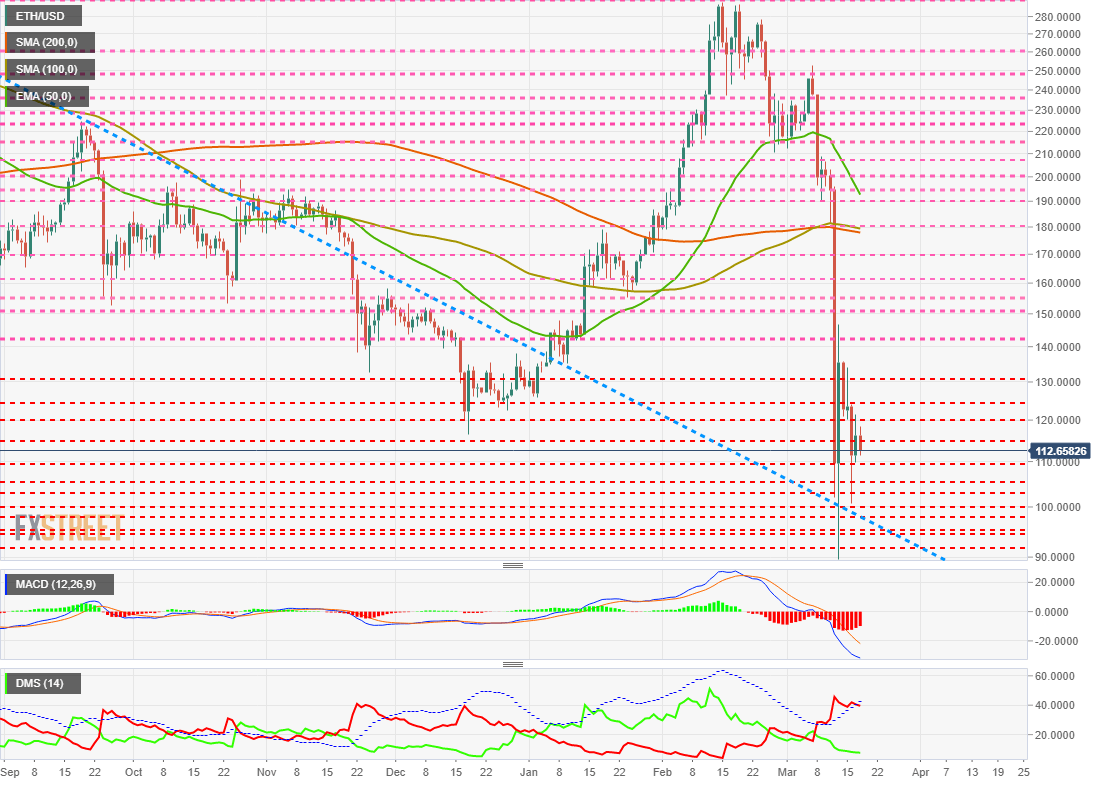
The DMI on the daily chart shows that the bears are losing the support of the ADX line and are terminating the bearish trend. This setup doesn't mean that there can't be more price declines, but in any case, it would be within a terminal process.
XRP/USD Daily Chart
XRP/USD is currently trading at the price level of $0.1439 and is consolidating into the lower price levels reached after the sell-off.
Above the current price, the first resistance level is at $0.15, then the second at $0.17 and the third one at $0.19.
Below the current price, the first support level is at $0.135, then the second at $0.128 and the third one at $0.122.
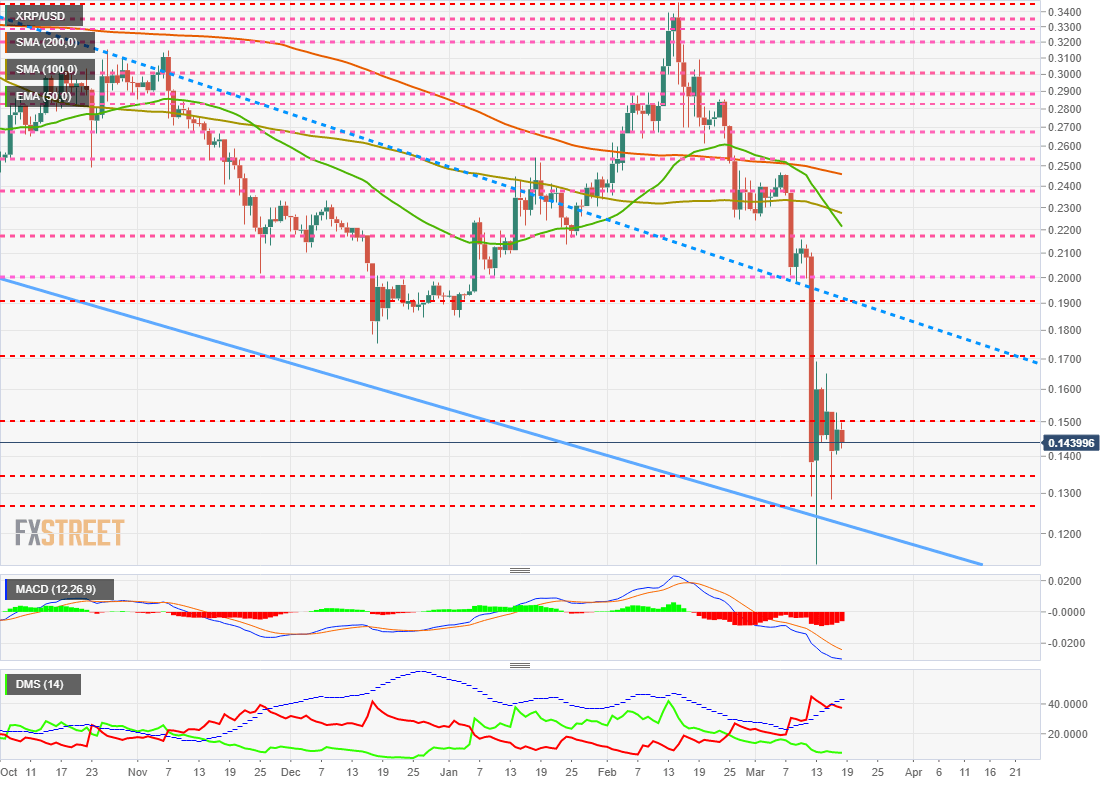
The DMI on the daily chart shows bears losing strength while bulls do not react. The buying side shows very little confidence in their options to snatch the lead from the selling hand.
Get 24/7 Crypto updates in our social media channels: Give us a follow at @FXSCrypto and our FXStreet Crypto Trading Telegram channel
Author

Tomas Salles
FXStreet
Tomàs Sallés was born in Barcelona in 1972, he is a certified technical analyst after having completing specialized courses in Spain and Switzerland. He expanded his technical training following the guidance of great experts on the financial markets.


