Three reasons why the Zcash upward trend could take a breather
- Zcash price extends the correction on Friday after a massive surge earlier this week.
- Derivatives metrics suggest a near-term correction as funding rates turn negative and short bets rise among traders.
- Momentum indicators show bearish divergence, suggesting the current rally is overheating and that a short-term pullback is likely.

Zcash (ZEC) price extends its correction, trading below $656 after a massive surge earlier this week. Weakening derivatives and on-chain data, alongside bearish divergences in momentum indicators, suggest the current rally may be overheating and vulnerable to a near-term cooldown or reversal.
Derivatives metrics turn negative
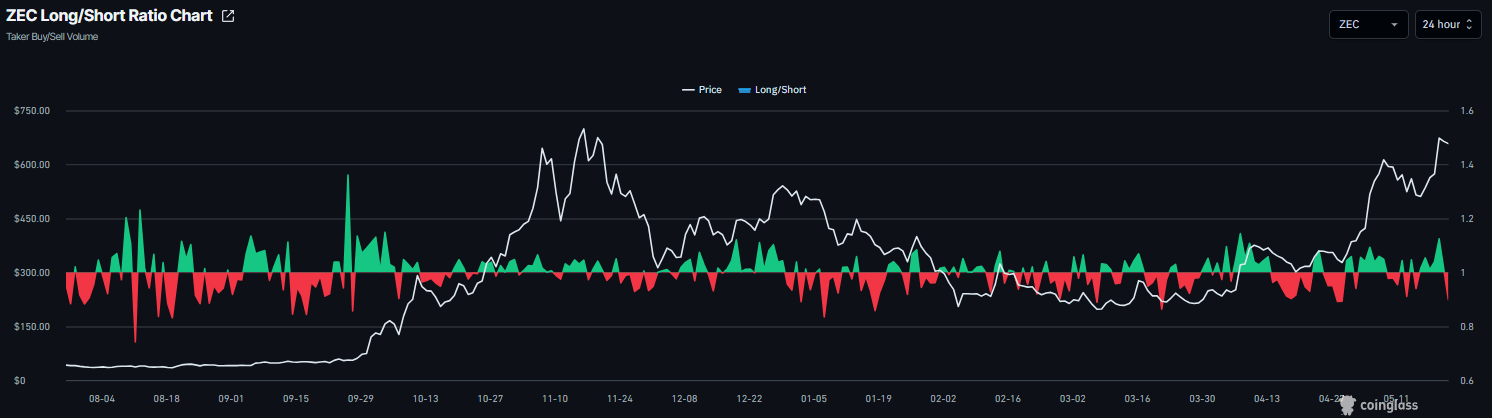
Zcash’s derivatives metrics show early signs of caution. Coinglass long-to-short ratio reads 0.89 on Friday. This ratio being below one indicates a bearish sentiment as ZEC’s traders are betting on the price to fall.
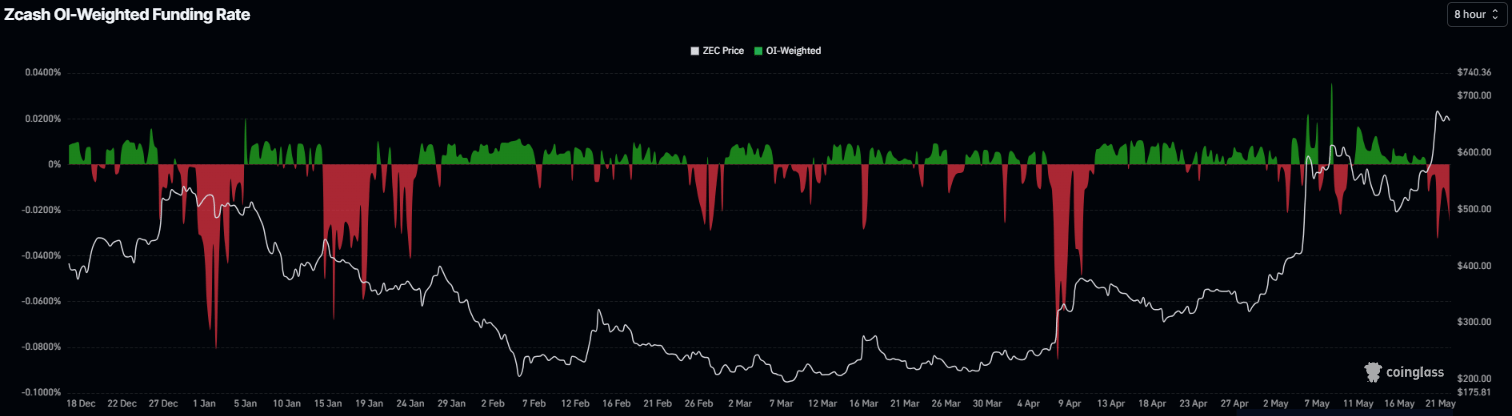
In addition to the rising short bets, the funding rates data also support the bearish outlook. ZEC’s funding rates flipped negative on Tuesday and fall to -0.024% on Friday. These negative rates indicate that shorts are paying longs and projecting a bearish sentiment. Historically, when rates flip negative and decline, ZEC’s price has fallen sharply.
On-chain data shows bearish bias
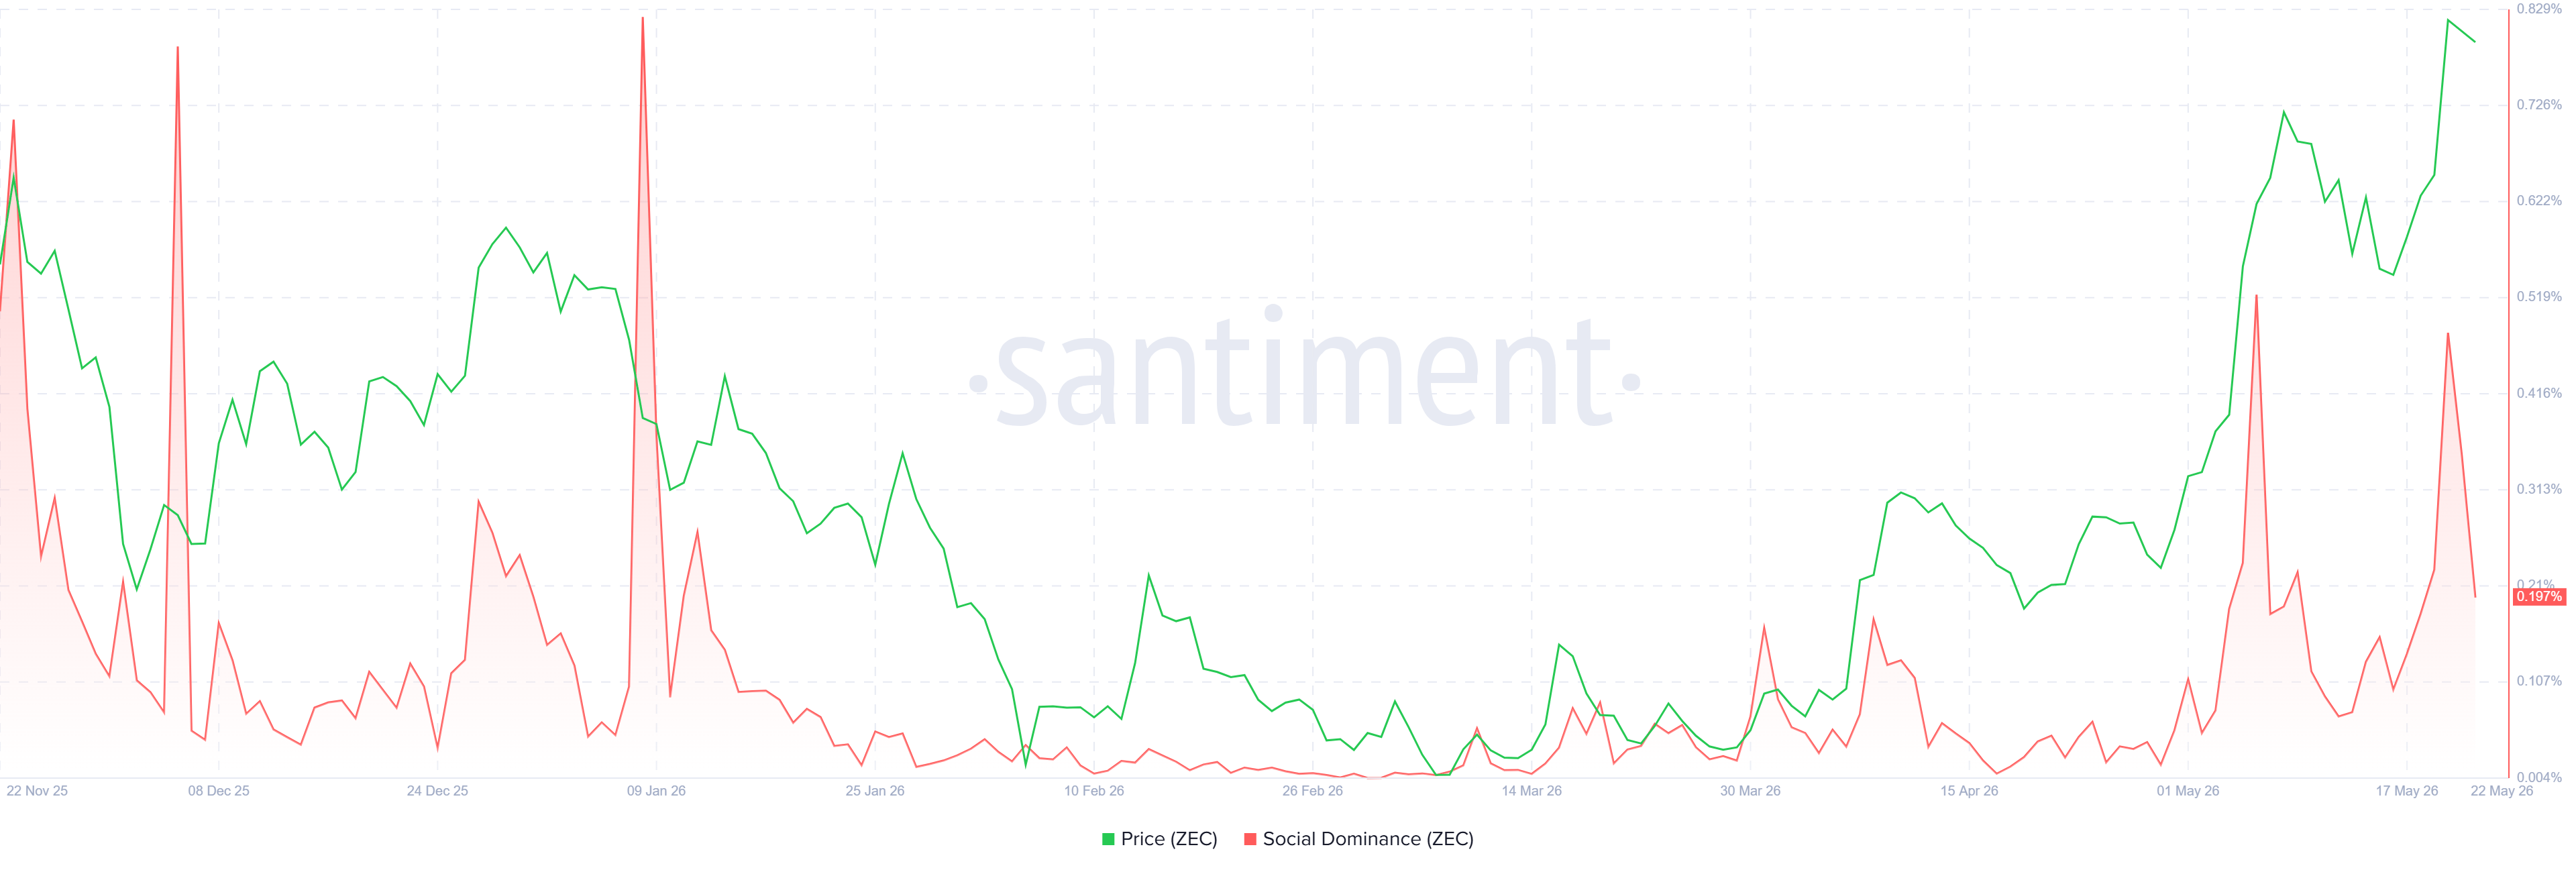
Santiment’s Social Dominance metric for Zcash hints at a bearish bias. The index measures the share of ZEC-related discussions across the cryptocurrency media. The metric falls sharply, reading 0.197% on Friday, returning to levels before this week’s recent price rally. This decline indicates fading market interest and sentiment among ZEC investors.
Technical outlook: Bearish divergence in momentum indicators
Zcash price surged over 17% on Wednesday, reaching a new year-to-date (YTD) high and levels not seen since November 21. This yearly high nears the key overhead supply zone around $699, which could act as resistance.
ZEC price remains above the key Exponential Moving Averages (EMAs), indicating the primary trend remains bullish. However, the momentum indicators show some early signs of caution.
The Relative Strength Index (RSI) for Wednesday’s highs doesn’t show a higher high than the May 9 highs. Similarly, the Awesome Oscillators project a similar trend. This trend is known as a bearish divergence, indicating that the current rally is overheating and may need a cooldown first, leading to a short-term price correction. The bearish thesis is further strengthened by the shooting star candlestick pattern on Thursday, a bearish reversal signal. At the time of writing, ZEC is trading down at $656 on Friday.
If ZEC continues its pullback, it could extend the decline toward the horizontal support level around $530.
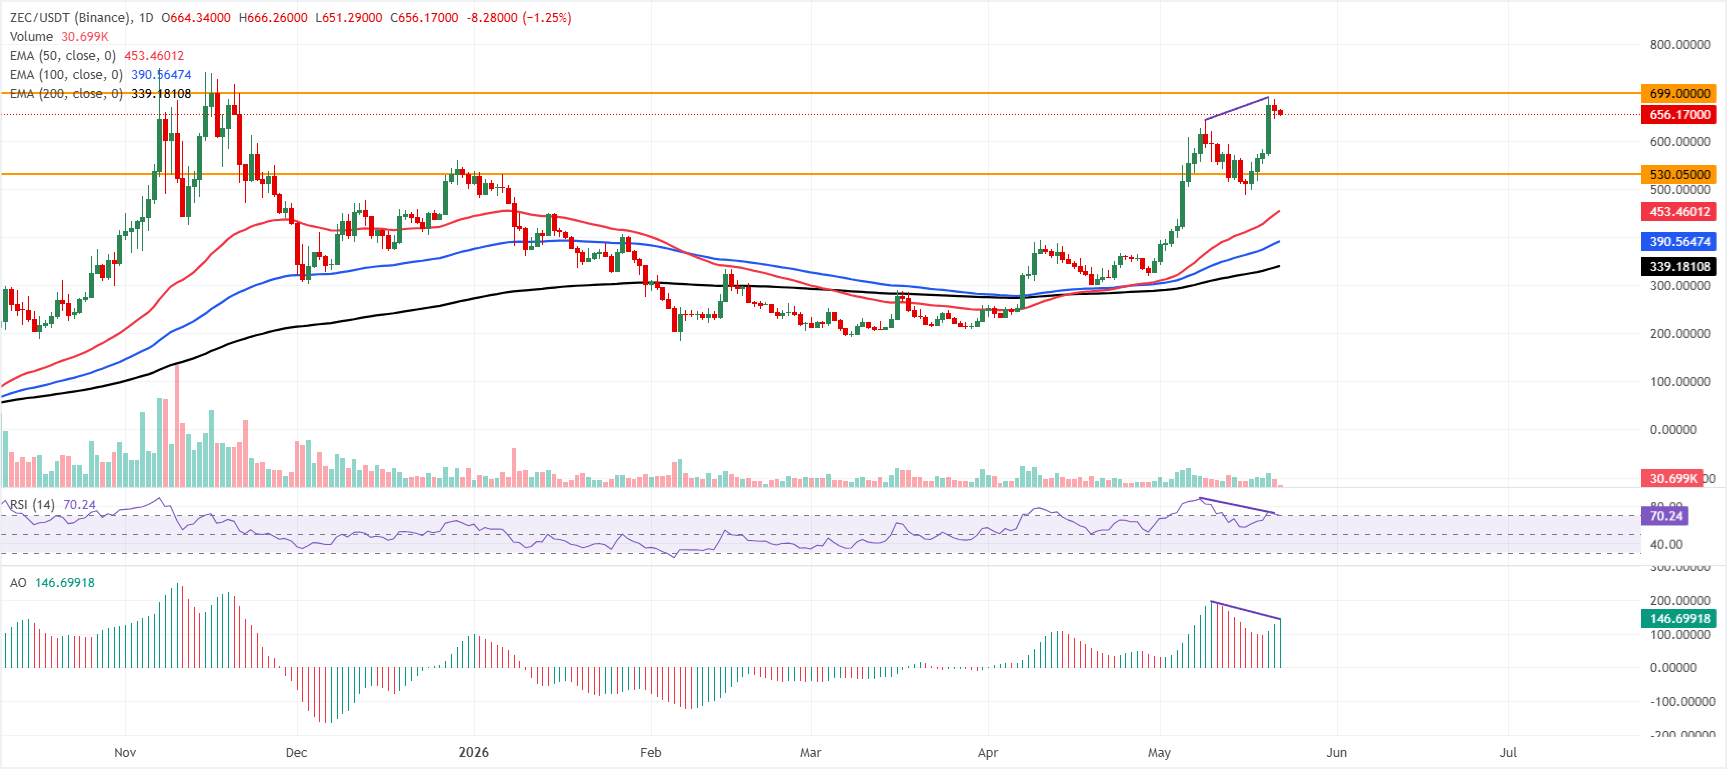
However, the bearish thesis would be invalidated if ZEC closes above the $699 resistance zone on a daily basis. In such a case, it could extend the advance toward the next psychological levels near $750.
Author

Manish Chhetri
FXStreet
Manish Chhetri is a crypto specialist with over four years of experience in the cryptocurrency industry.