XRP extends strong bullish breakout as technical support underpins rally
- XRP accelerates breakout, trading above $1.40 on Friday, up over 12%.
- Investors return, as spot ETFs see $13 million in inflows while perpetual futures Open Interest climbs to 2.5 billion XRP.
- XRP flips bullish with major moving averages providing support and the RSI showing overstretched momentum.

Ripple (XRP) rises on Friday to trade above $1.40 as bulls aim for a continuation of the rally above $1.50. The remittance token is up by more than 12% on the day and over 40% since Monday, reinforcing the bullish outlook.
Meanwhile, the path of least resistance remains upward, supported by a very strong technical structure and capital inflows through spot Exchange-Traded Funds (ETFs) and derivatives.
Market sentiment improves as XRP capital inflows increase
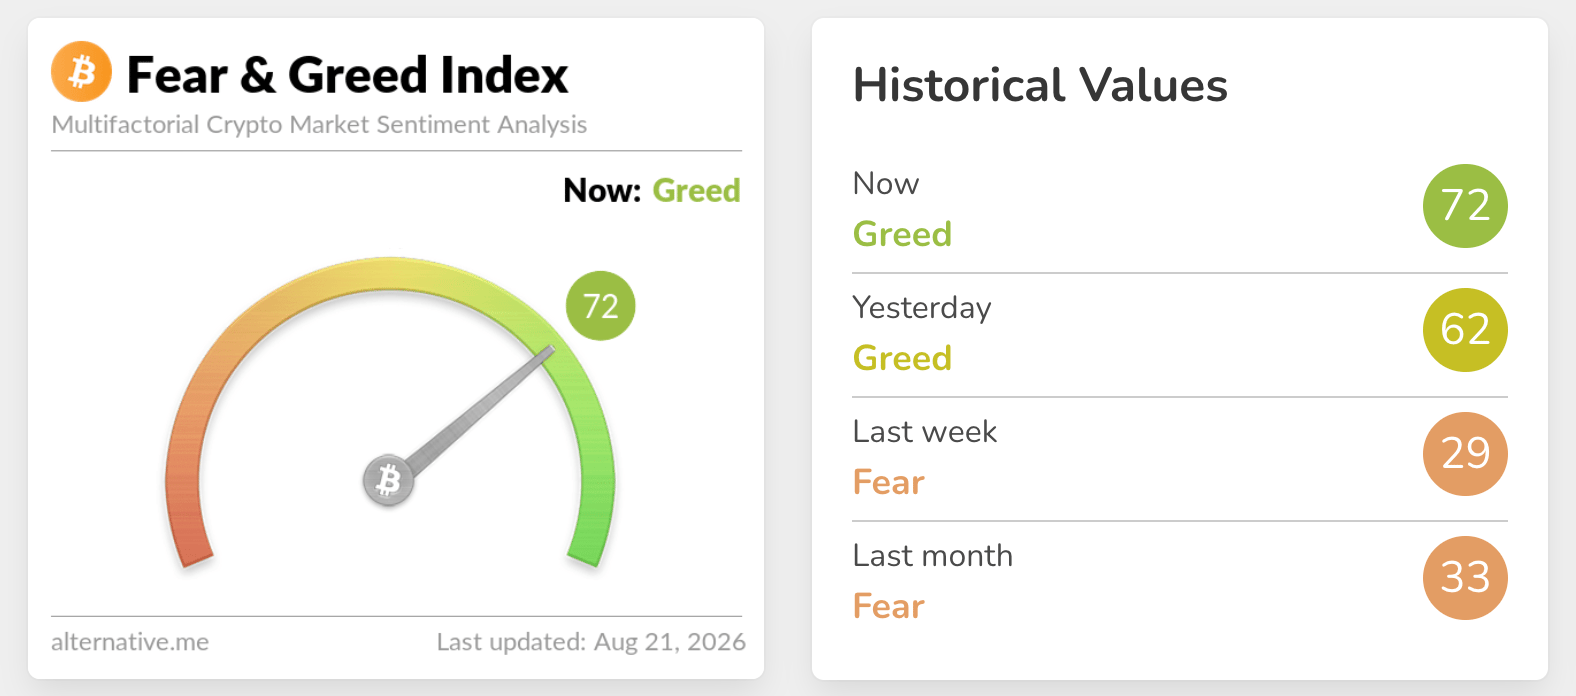
Market sentiment remains robust, with the Fear & Greed Index climbing to 72 from 62 in just 24 hours. This uptick signals a rising risk appetite that continues to ground the current rally.
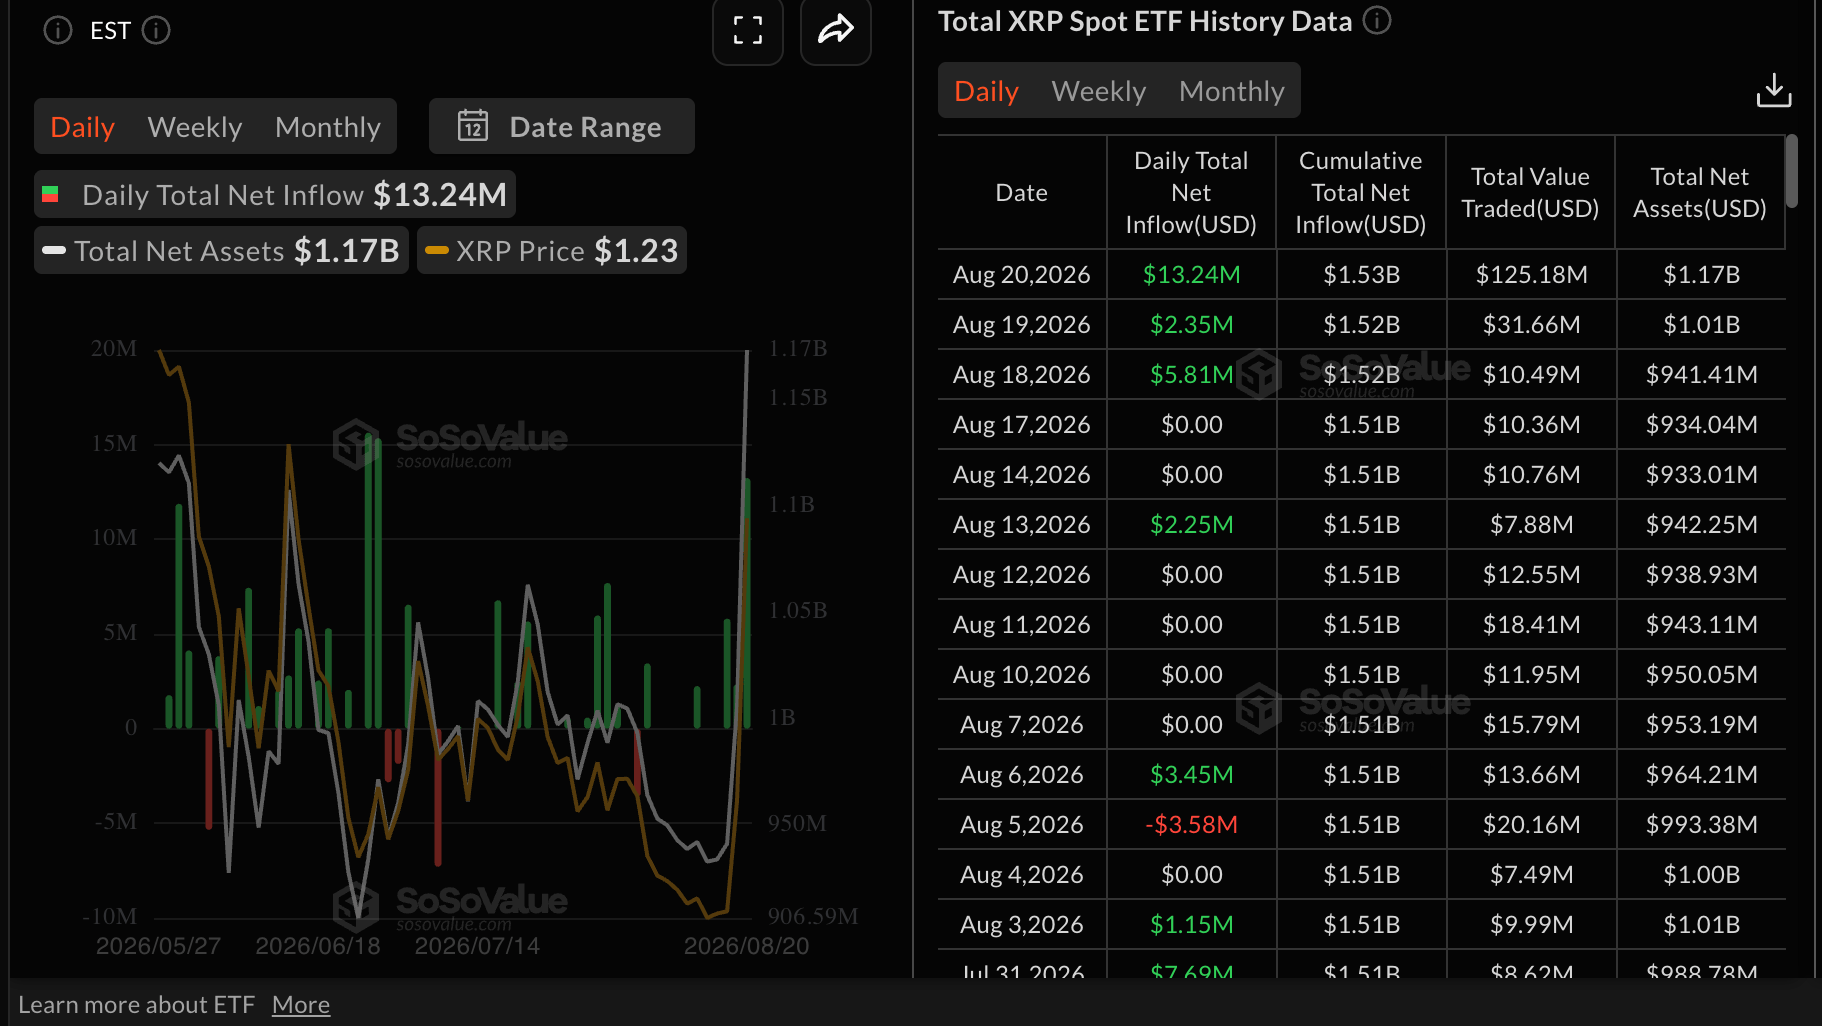
US-listed XRP spot ETFs reflected the growth in risk-on sentiment, with inflows totaling $13.4 million on Thursday, up from $2.35 million the day before. So far this week, inflows total $21.4 million, bringing cumulative volume to $1.53 billion and net assets under management to $1.17 billion. If sustained, the capital increase could continue to lift XRP’s outlook.
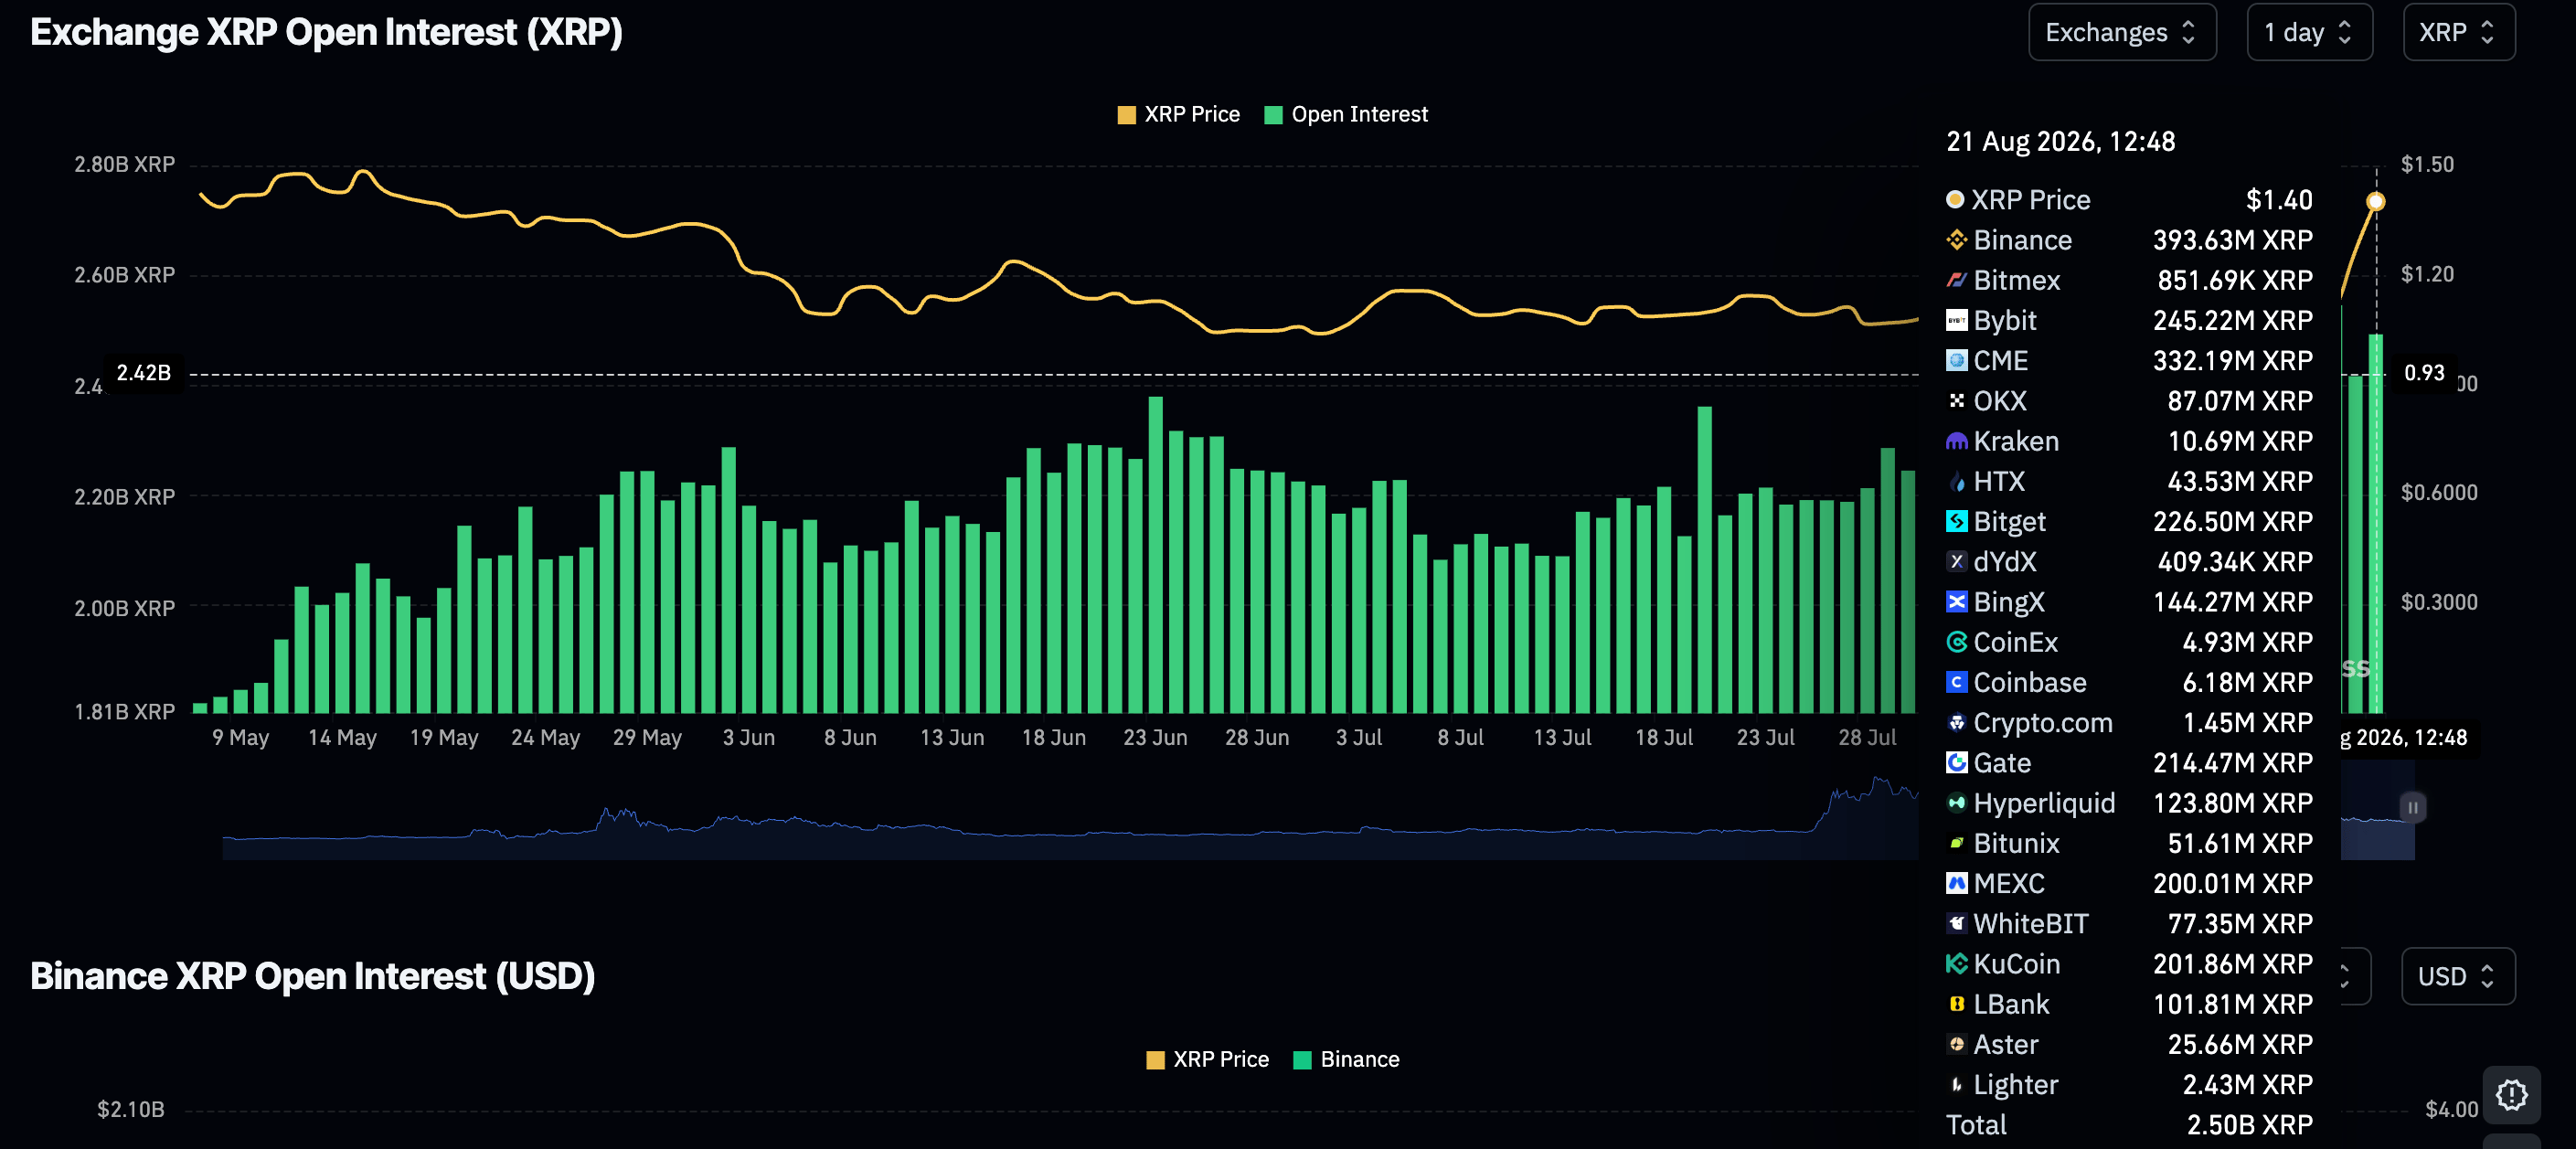
Retail demand, similarly, increased on Friday, with perpetual futures Open Interest (OI) averaging 2.5 billion XRP, from 2.42 billion XRP. CoinGlass data shows that OI peaked at 2.78 billion XRP on August 15 but corrected as traders assessed the broader outlook amid rising Middle East tensions and macro uncertainty. If the recovery continues, XRP could build strong momentum toward gains above $1.50.
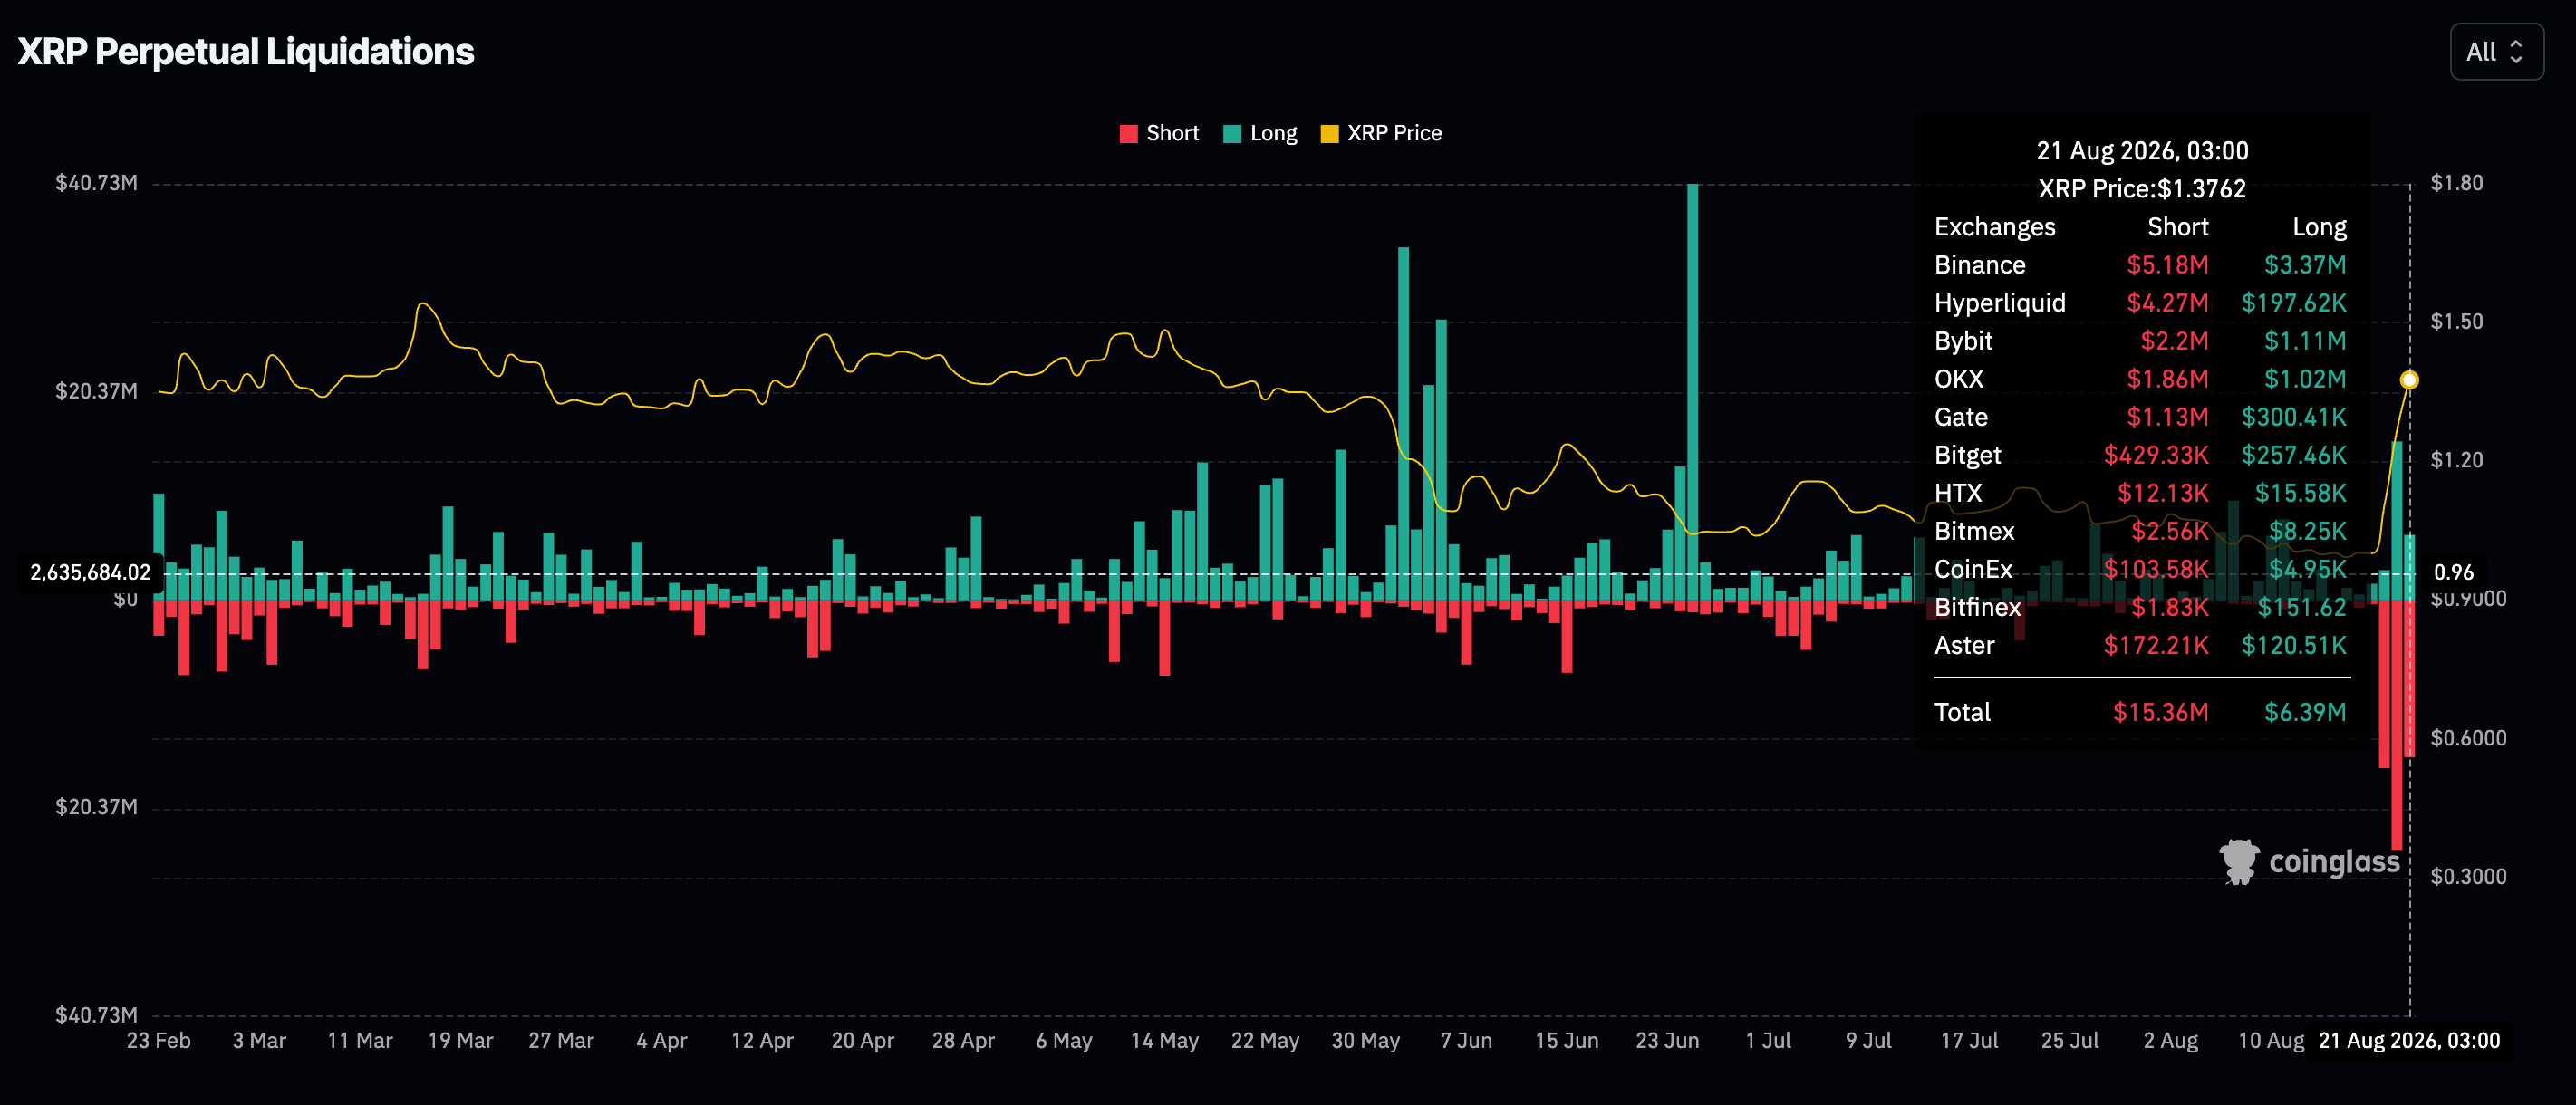
Meanwhile, short liquidations remain high, with investors losing over $15 million so far on Friday. Approximately $25 million in short positions were wiped out on Thursday as XRP advanced. Long liquidations are also rising but holding at $6 million at the time of writing, compared to nearly $16 million the day before.
Technical analysis: XRP eyes short-term breakout toward $1.50
XRP trades at $1.42, extending a strong bullish phase after reclaiming all major Exponential Moving Averages (EMAs). The SuperTrendline near $1.14 reinforces this constructive tone, while the downward resistance trendline, now broken with a key level near $0.99, has turned into a deeper structural floor.
Momentum is stretched, as the Relative Strength Index (RSI) hovers in overbought territory at 84 and the Moving Average Convergence Divergence (MACD) remains bullish with a positive reading, hinting at strong but potentially overextended buying pressure.
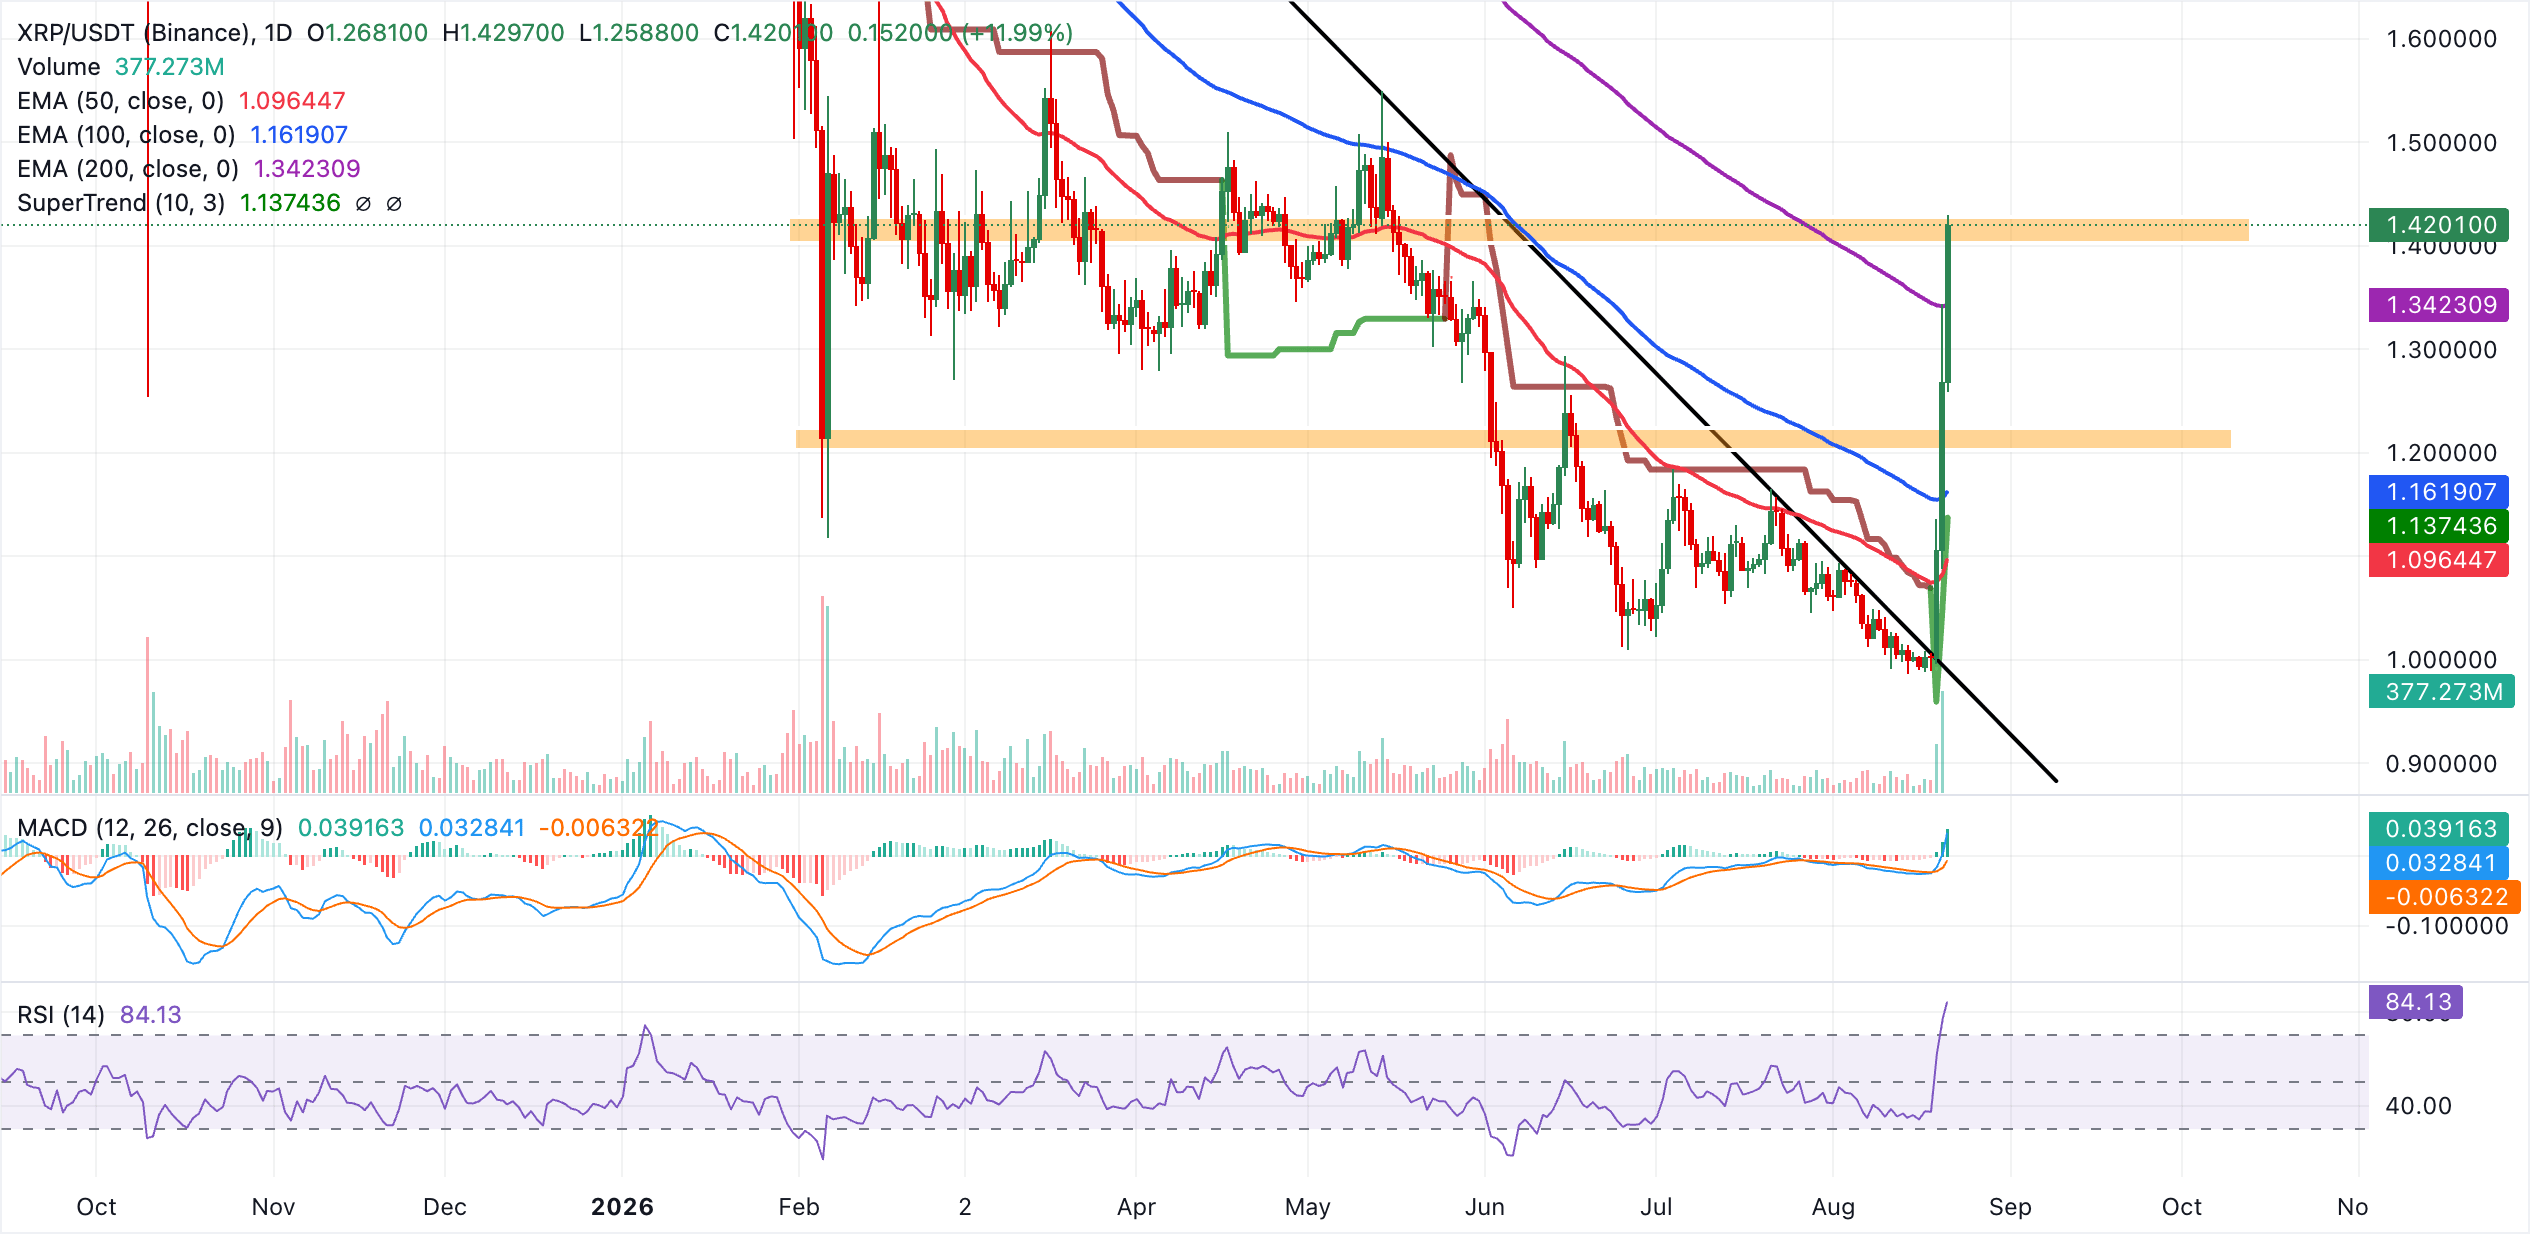
Initial support emerges at the 200-day EMA around $1.34, followed by the 100-day EMA at $1.16 and the SuperTrend level near $1.14, which define a broad demand zone on any corrective pullback. Deeper support lies at the 50-day EMA near $1.10, with a more distant structural base around the former trendline break level at $0.99. With no nearby technical resistance levels on the daily chart, the pair would likely need a pause or consolidation to ease overbought conditions before attempting further upside extension.
(The technical analysis of this story was written with the help of an AI tool. Know more.)
Cryptocurrency metrics FAQs
The developer or creator of each cryptocurrency decides on the total number of tokens that can be minted or issued. Only a certain number of these assets can be minted by mining, staking or other mechanisms. This is defined by the algorithm of the underlying blockchain technology. On the other hand, circulating supply can also be decreased via actions such as burning tokens, or mistakenly sending assets to addresses of other incompatible blockchains.
Market capitalization is the result of multiplying the circulating supply of a certain asset by the asset’s current market value.
Trading volume refers to the total number of tokens for a specific asset that has been transacted or exchanged between buyers and sellers within set trading hours, for example, 24 hours. It is used to gauge market sentiment, this metric combines all volumes on centralized exchanges and decentralized exchanges. Increasing trading volume often denotes the demand for a certain asset as more people are buying and selling the cryptocurrency.
Funding rates are a concept designed to encourage traders to take positions and ensure perpetual contract prices match spot markets. It defines a mechanism by exchanges to ensure that future prices and index prices periodic payments regularly converge. When the funding rate is positive, the price of the perpetual contract is higher than the mark price. This means traders who are bullish and have opened long positions pay traders who are in short positions. On the other hand, a negative funding rate means perpetual prices are below the mark price, and hence traders with short positions pay traders who have opened long positions.
Author

John Isige
FXStreet
John Isige is a seasoned cryptocurrency journalist and markets analyst committed to delivering high-quality, actionable insights tailored to traders, investors, and crypto enthusiasts. He enjoys deep dives into emerging Web3 tren




