Theta Token Elliott Wave technical analysis [Video]
![Theta Token Elliott Wave technical analysis [Video]](https://editorial.fxstreet.com/images/Markets/Currencies/Cryptocurrencies/Theta/theta-150x150logo-637399981745974975.png)
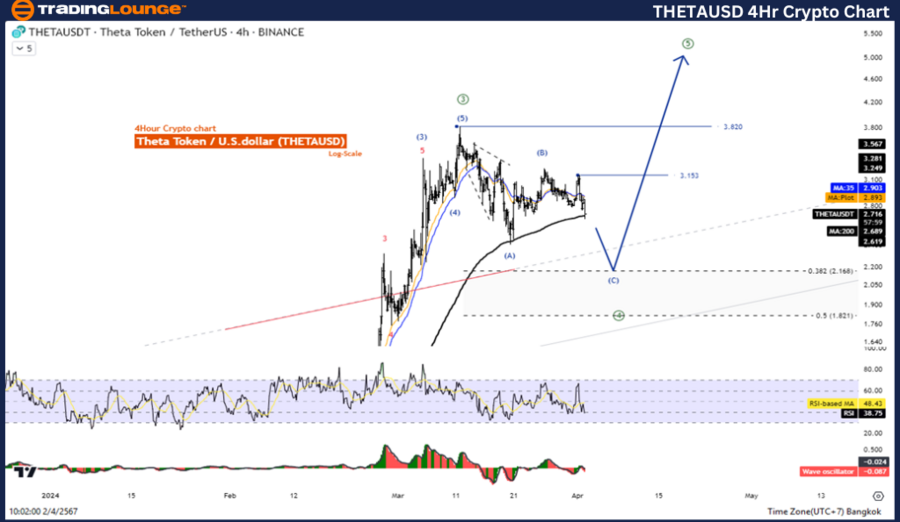
THETA/USD Elliott Wave technical analysis
Function: Counter trend.
Mode: Corrective.
Structure: Flat.
Position: Wave ((B)).
Direction next higher degrees: Wave I of Impulse.
Details: the corrective of Wave 4 has a trend to 38.2% of Wave 3.
THETA/USD trading strategy
Theta Token is still in an uptrend. With the Impulse style movement, we are still missing two more moves to complete the style. in the fourth wave decline and increase again in the fifth wave. And currently prices are correcting in the fourth wave. It is likely to go down to test 2.168, waiting for the correction to complete to join the trend again.
Theta Token/ U.S. dollar(THETAUSD)Technical Indicators: The price is above the MA200 indicating an Uptrend, The Wave Oscillator is a bullish Momentum
THETA/USD Elliott Wave technical analysis
Function: Counter trend.
Mode: Corrective.
Structure: Flat Position: Wave ((B)).
Direction next higher degrees: wave I of Impulse.
Details: the corrective of Wave 4 has a trend to 38.2% of Wave 3.
THETA/USD trading strategy
Theta Token is still in an uptrend. With the Impulse style movement, we are still missing two more moves to complete the style. in the fourth wave decline and increase again in the fifth wave. And currently prices are correcting in the fourth wave. It is likely to go down to test 2.168, waiting for the correction to complete to join the trend again.
Theta Token/ U.S. dollar(THETAUSD)Technical Indicators: The price is above the MA200 indicating an Uptrend, The Wave Oscillator is a bullish Momentum.
Theta Token Elliott Wave technical analysis [Video]
Author

Peter Mathers
TradingLounge
Peter Mathers started actively trading in 1982. He began his career at Hoei and Shoin, a Japanese futures trading company.


