These crucial on-chain metrics will help you profit the most from DeFi’s high volatility
- The DeFi craze seems to be far from over as trading volume keeps increasing.
- Several on-chain metrics that can be used to have an edge in this market sector.

Decentralized finance (DeFi) has seen a lot of hype in the cryptocurrency market. The increasing volume further reinforces the belief that it is yet to lose interest in this market.
Before this time, cryptocurrency traders only had to work with fundamental and technical indicators to determine a trend's direction. Now, on-chain metrics provide a holistic view of any digital assets, showing what is happening behind closed doors. Challenges and opportunities prevalent in the DeFi market
DeFi has gained a lot of traction lately as it brings some of the essential financial services controlled by banks to the people. Lending, borrowing, staking, and yield farming is some of the different services that can be performed on an open-source permissionless platform.
The use of on-chain metrics to analyze the price action of multiple cryptocurrencies within this market sector enables the opportunity to obtain the most intelligent financial vehicle in the history of finance. For instance, the automated market maker (AMM) is a decentralized protocol that serves as an exchange platform to price many DeFi assets.
These on-chain indicators reduce some of the AMM risks and challenges, such as impermanent losses during high volatility periods.
On-chain metrics to profit the most from DeFi tokens
Bitcoin Locked on Ethereum: This is one of the most critical indicators that give a glimpse into circulating Bitcoin being used to participate in Defi protocols, such as AMM. This tool further corroborates the data shown on BTC's dominance chart.
It shows the direct inflow and outflow of the pioneer cryptocurrency to other Ethereum-based assets through Wrapped BTC, which is currently at an all-time high. Such market behavior can be perceived as an increase in Bitcoin holders who want to participate in the DeFi market sector.
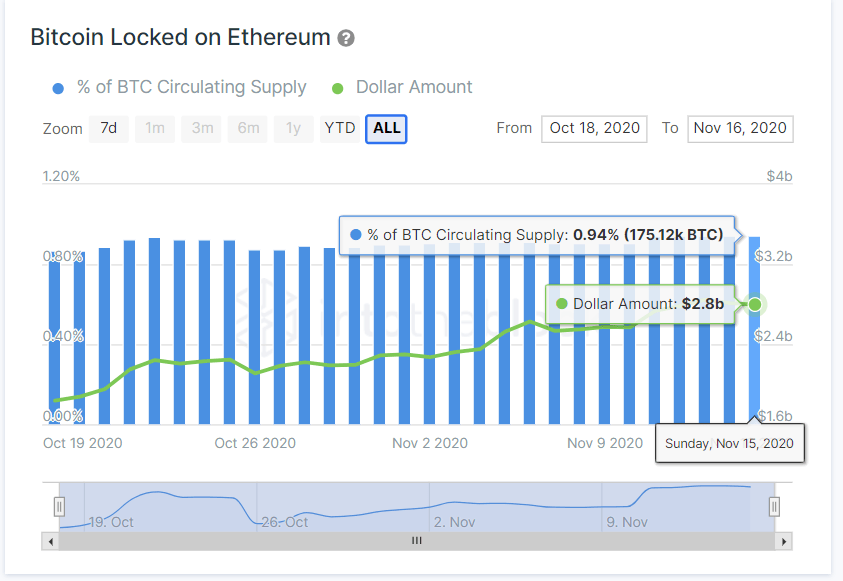
Bitcoin Locked on Ethereum by IntoTheBlock
Top Five Value Locked: The total amount of coins locked is a parameter used a lot within the DeFi ecosystem. It shows the amount of money vested in some of the most prominent protocols in this market sector. While this tool essentially shows the projects with the most vibrant markets to participate in, it should be used in tandem with other gauges, such as the number of active addresses.
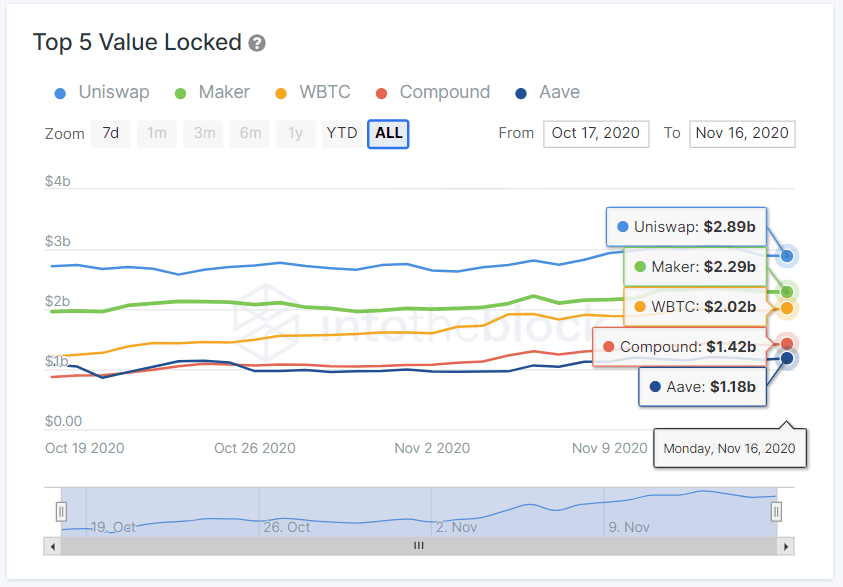
Top Five Value Locked by IntoTheBlock
DeFi Tokens Active Addresses: This metric reveals the aggregate number of dynamic addresses that use DeFi tokens within a 24-hour timeframe spread out over an extended period. Traders can use it to understand the volume of transactions and the level of participation in any given project, eliminating the risk of potential pumps and dumps in the market.
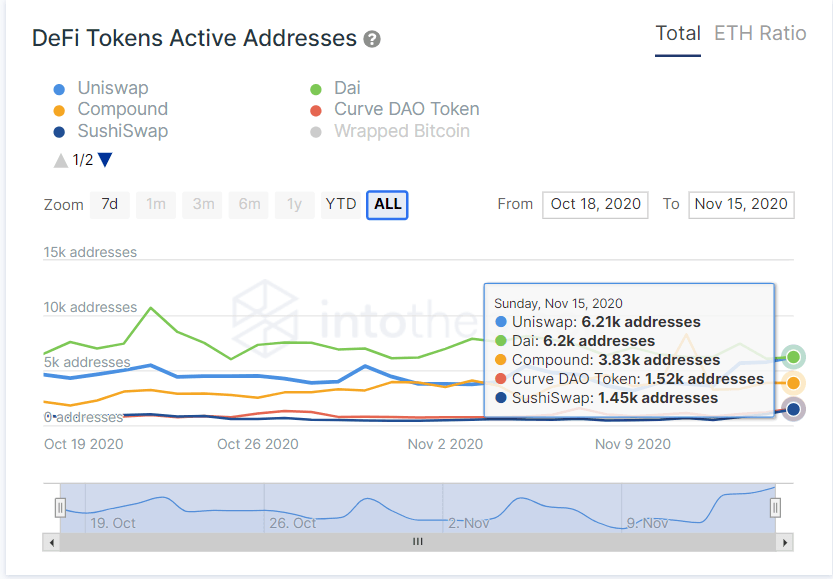
DeFi Tokens Active Addresses by IntoTheBlock
In/Out of Money: This statistical model aims to estimate profitability across different wallets using on-chain data. Thus, it shows a macro perspective of the flow of assets across various DeFi protocols and gives investors an edge to not leave the market too late.
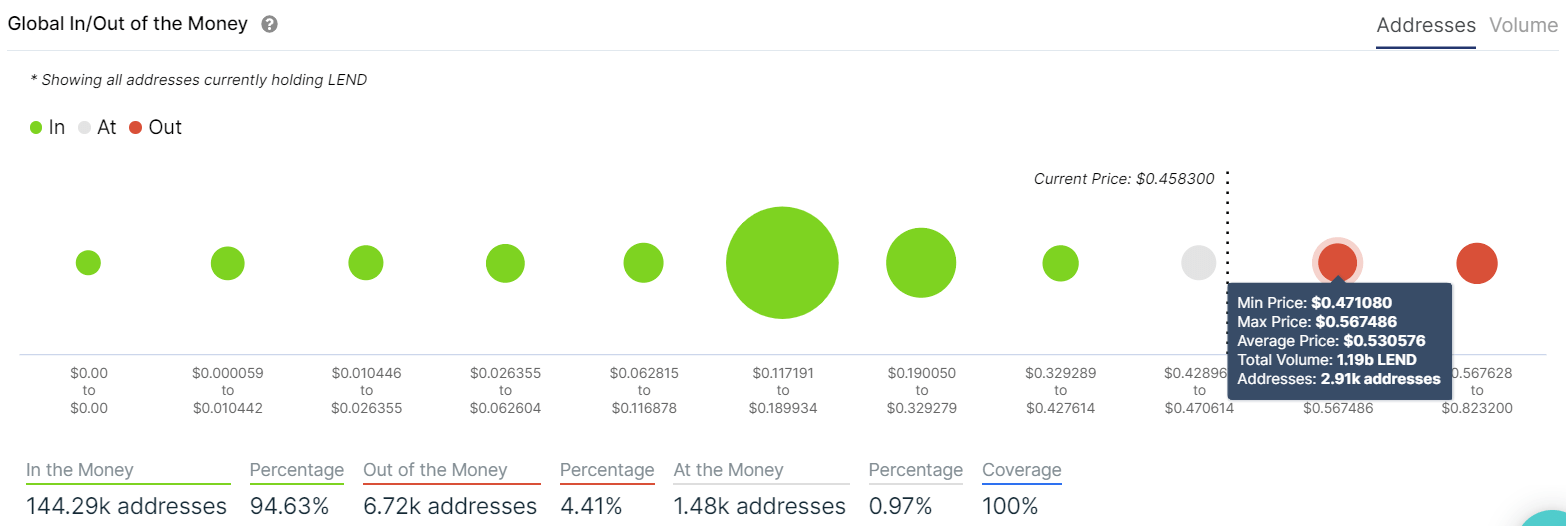
In/Out of Money for Aave by IntoTheBlock
The application of on-chain metrics in the DeFi world could quickly revolutionize data in the financial space and give investors huge leverage in their trading activities. Like every other type of analysis, it is best to combine various tools to get a broad and balanced view of the market.
Author
FXStreet Team
FXStreet
Composed of a group of economic journalists and FX experts, the FXStreet content team produces and oversees all content published on FXStreet. It provides a purely journalistic approach to the Forex market.


