Tezos Price Forecast: XTZ boasts solid support, pursues higher prices
- Tezos price successfully tests the May low after a 19% plunge on June 21.
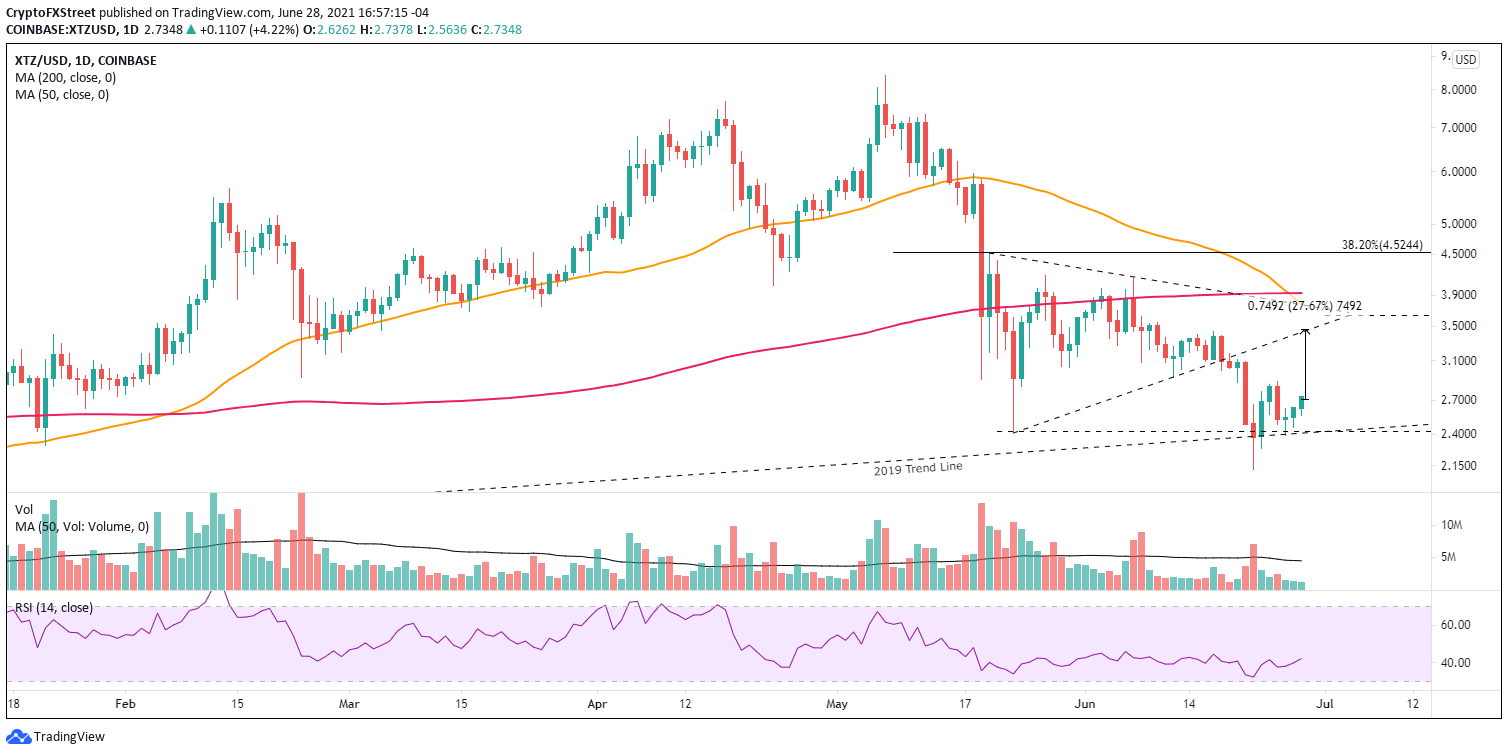
- 2019 trend line tested again, marking the first time since December 2020.
- Bearish Death Cross pattern activated on June 27 creates a new obstacle for the emerging XTZ rally.

Tezos price is attempting to rebound from the second test of the May low in five days, but the bid has not been overwhelming, reflecting a tentativeness to engage XTZ while altcoins remain trendless. However, if a strong volume profile reinforces price strength, the digital token has the support to rally almost 30% from price at the time of writing.
Tezos price trapped in the same current as other altcoins
Tezos price fell 75% from the May 7 high of $8.41 to the May 23 low of $2.42, matching the average decline for the altcoins. Interestingly, XTZ did not trigger an oversold reading on the daily Relative Strength Index (RSI), and it did not reach an oversold condition during last week’s test of the May low. The failure magnifies a lack of panic and could partially explain the lack of thrust accompanying the low.
Nevertheless, the successful test of the May low and the 2019 trend line establishes solid support, thereby justifying some optimism about Tezos price intentions, regardless of the lack of outsized demand for XTZ.
The first hurdle for Tezos price is the June 25 high of $2.88 and then the June 12 low of 2.92, followed by the June 17 high of $3.43, which currently coincides with the lower trend line of a symmetrical triangle. A XTZ rally of that magnitude would distribute a 28% gain from the current price.
If Tezos price breaks out above $3.43, it may tag the declining 50-day simple moving average (SMA) at $3.78, and maybe the 200-day SMA at $3.93. It will be a challenge to extend the advance beyond those levels as the weight of the Death Cross will pressure XTZ.
Critical to the mildly positive XTZ outlook is the emergence of a strong bid and increased clarity in the cryptocurrency market, particularly in the altcoin space. If demand ascends to the levels tallied following the May 23 plunge, Tezos price will test the defined levels cataloged above.
XTZ/USD daily chart
Conversely, a daily close below the XTZ May low of $2.42 and the 2019 trend line will introduce a new wrinkle and expose Tezos price to a sweep of last week’s low of $2.11, and if the selling accelerates, a sweep of the December 2020 low of $1.60. It would confirm the end of the longstanding uptrend from the 2018 low.
Since March 2020, the cryptocurrency market has conditioned investors and commentators to anticipate bold price action, up or down. At the core have been exaggerated forms of greed and fear, taking turns dictating the environment. However, it is important to consider that Tezos price may not strongly recover, opting for a directionless route.
Be sure; market operators are not prepared for a trendless investing backdrop, where greed and fear are displaced with restlessness principally due to unresolved portfolio losses.
Author

Sheldon McIntyre, CMT
Independent Analyst
Sheldon has 24 years of investment experience holding various positions in companies based in the United States and Chile. His core competencies include BRIC and G-10 equity markets, swing and position trading and technical analysis.


