Sui Price Forecast: Bulls regain strength on rising whale interest, TVL inflows
- Sui hovers above $0.9400 on Tuesday after a 7% rebound from the base support of a consolidation range the previous day.
- Derivatives data suggests an increase in whale interest as Open Interest rises by more than 6% in 24 hours.
- On-chain data shows an increase in capital inflow despite decreasing stablecoin liquidity on Sui.

Sui (SUI) price trades around $0.94 at press time on Tuesday, holding steady after a 7% surge the previous day. The rebound aligns with renewed interest from large wallet investors, commonly referred to as whales, and on-chain demand. Technically, SUI rebounds within a consolidation with bulls focusing on the 50-day Exponential Moving Average (EMA) breakout.
Sui shows on-chain growth amid piling whale orders
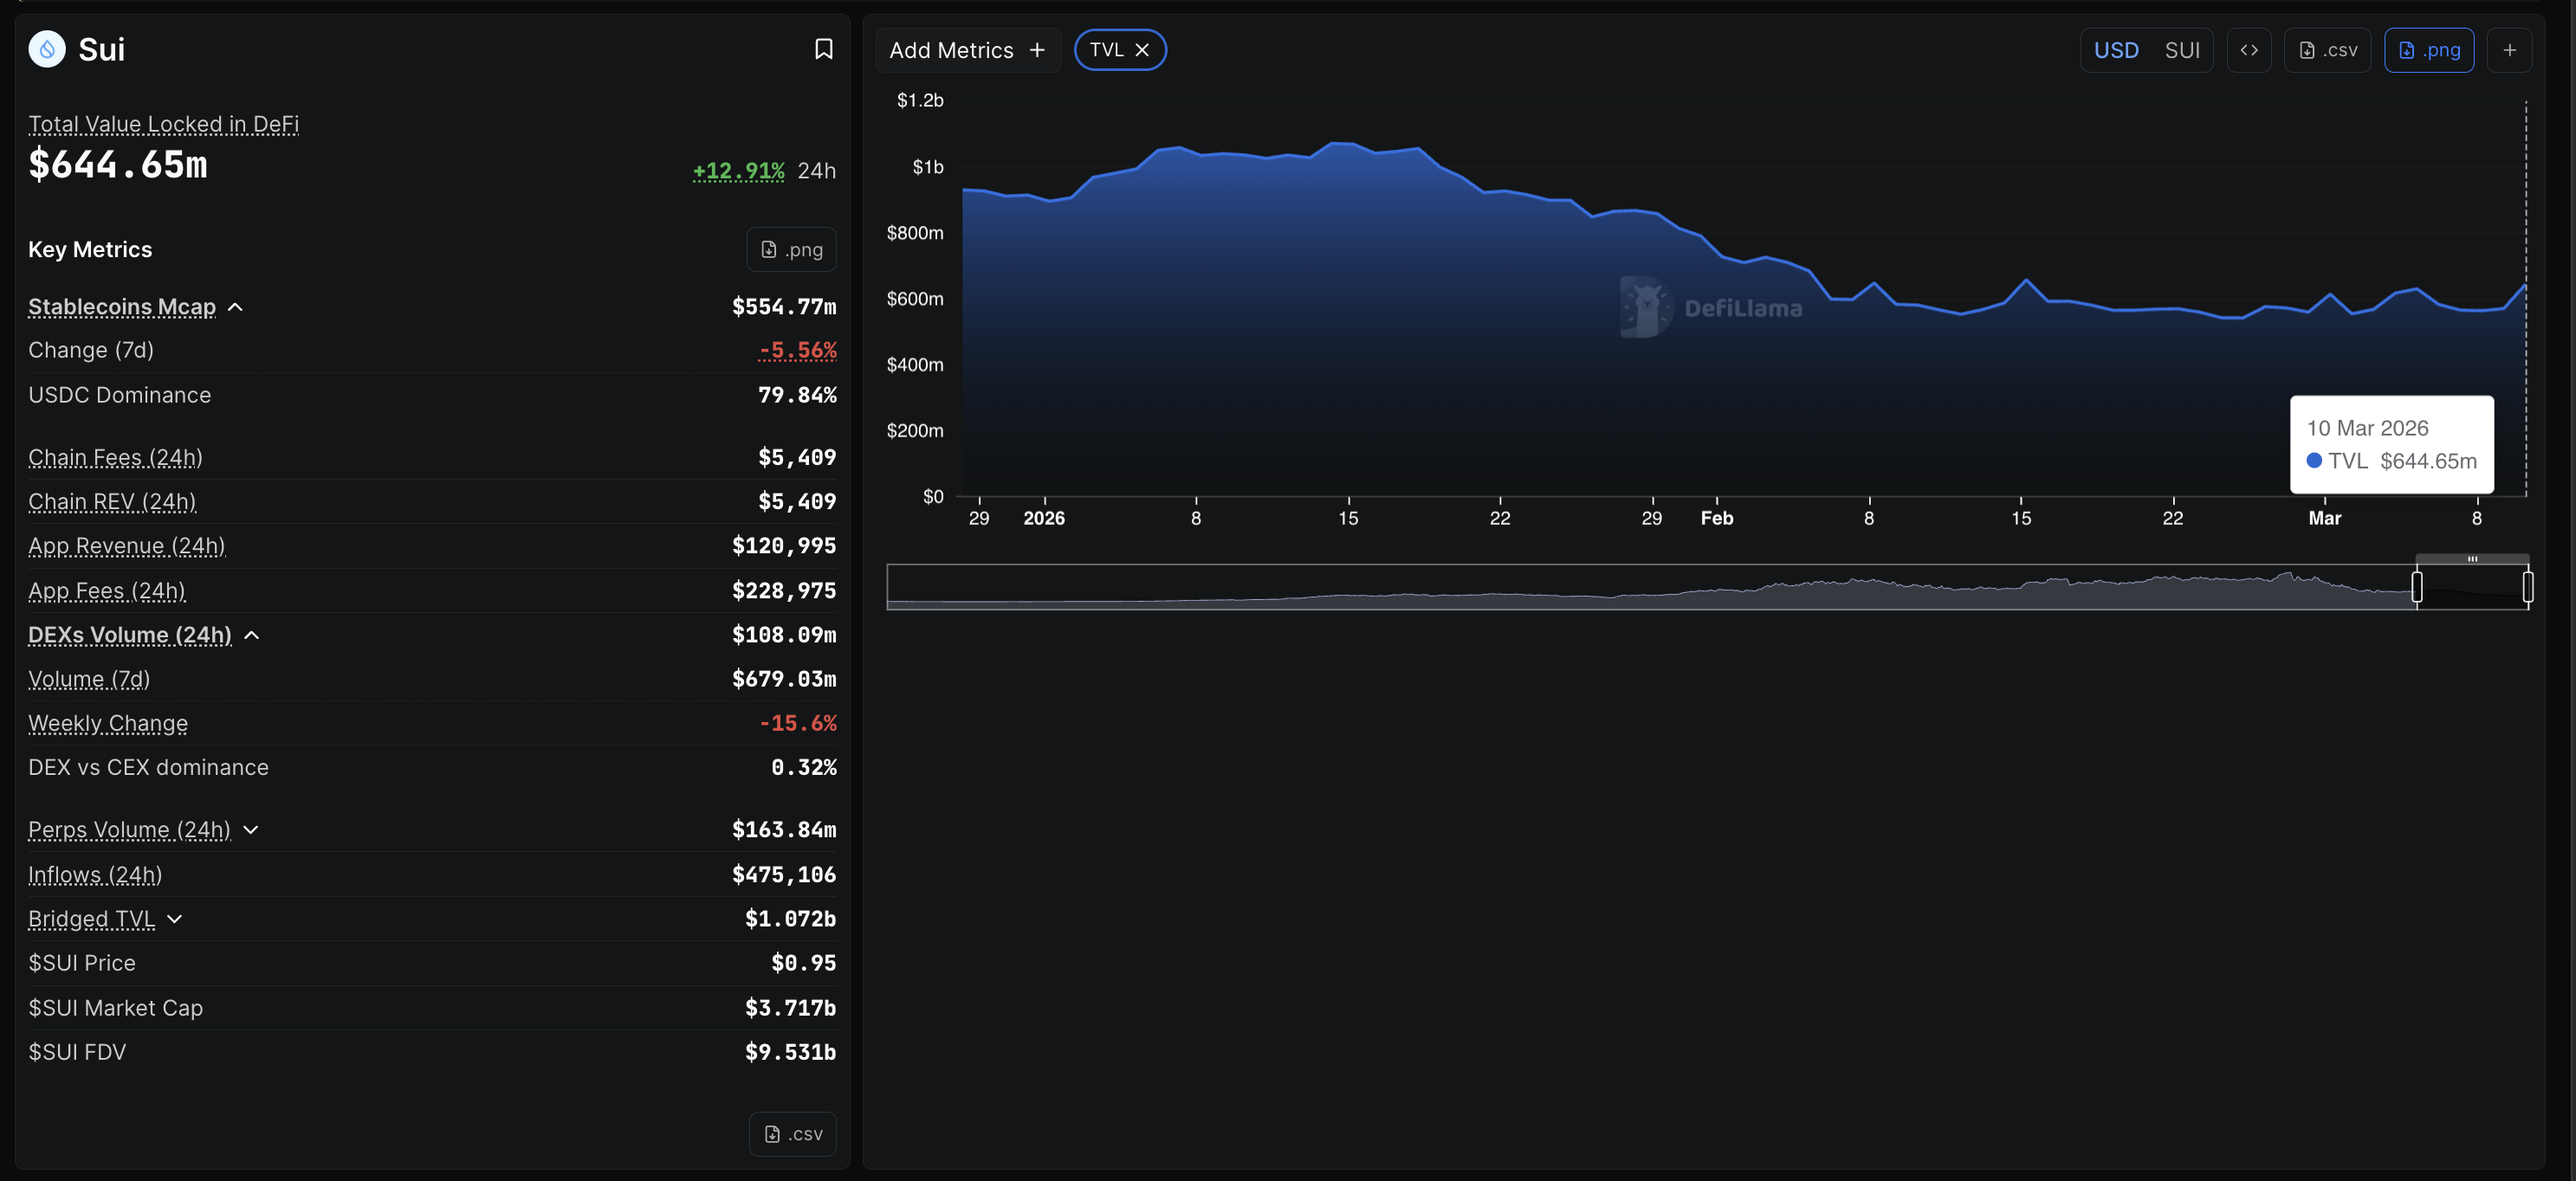
The demand for Sui as a layer-1 chain is resurfacing amid Donald Trump’s claim that the US-Iran war is nearing an end. DeFiLlama data shows that the Total Value Locked (TVL) on Sui is at $644.65 million, up nearly 13% in the last 24 hours, indicating increased on-chain capital inflow either via user deposits or a surge in the value of deposited digital assets.
Despite the TVL surge, on-chain data shows a cautionary upside bias, as the stablecoin market capitalization and Decentralized Exchanges (DEX) volume are down 5% and 15%, respectively, over the last seven days.
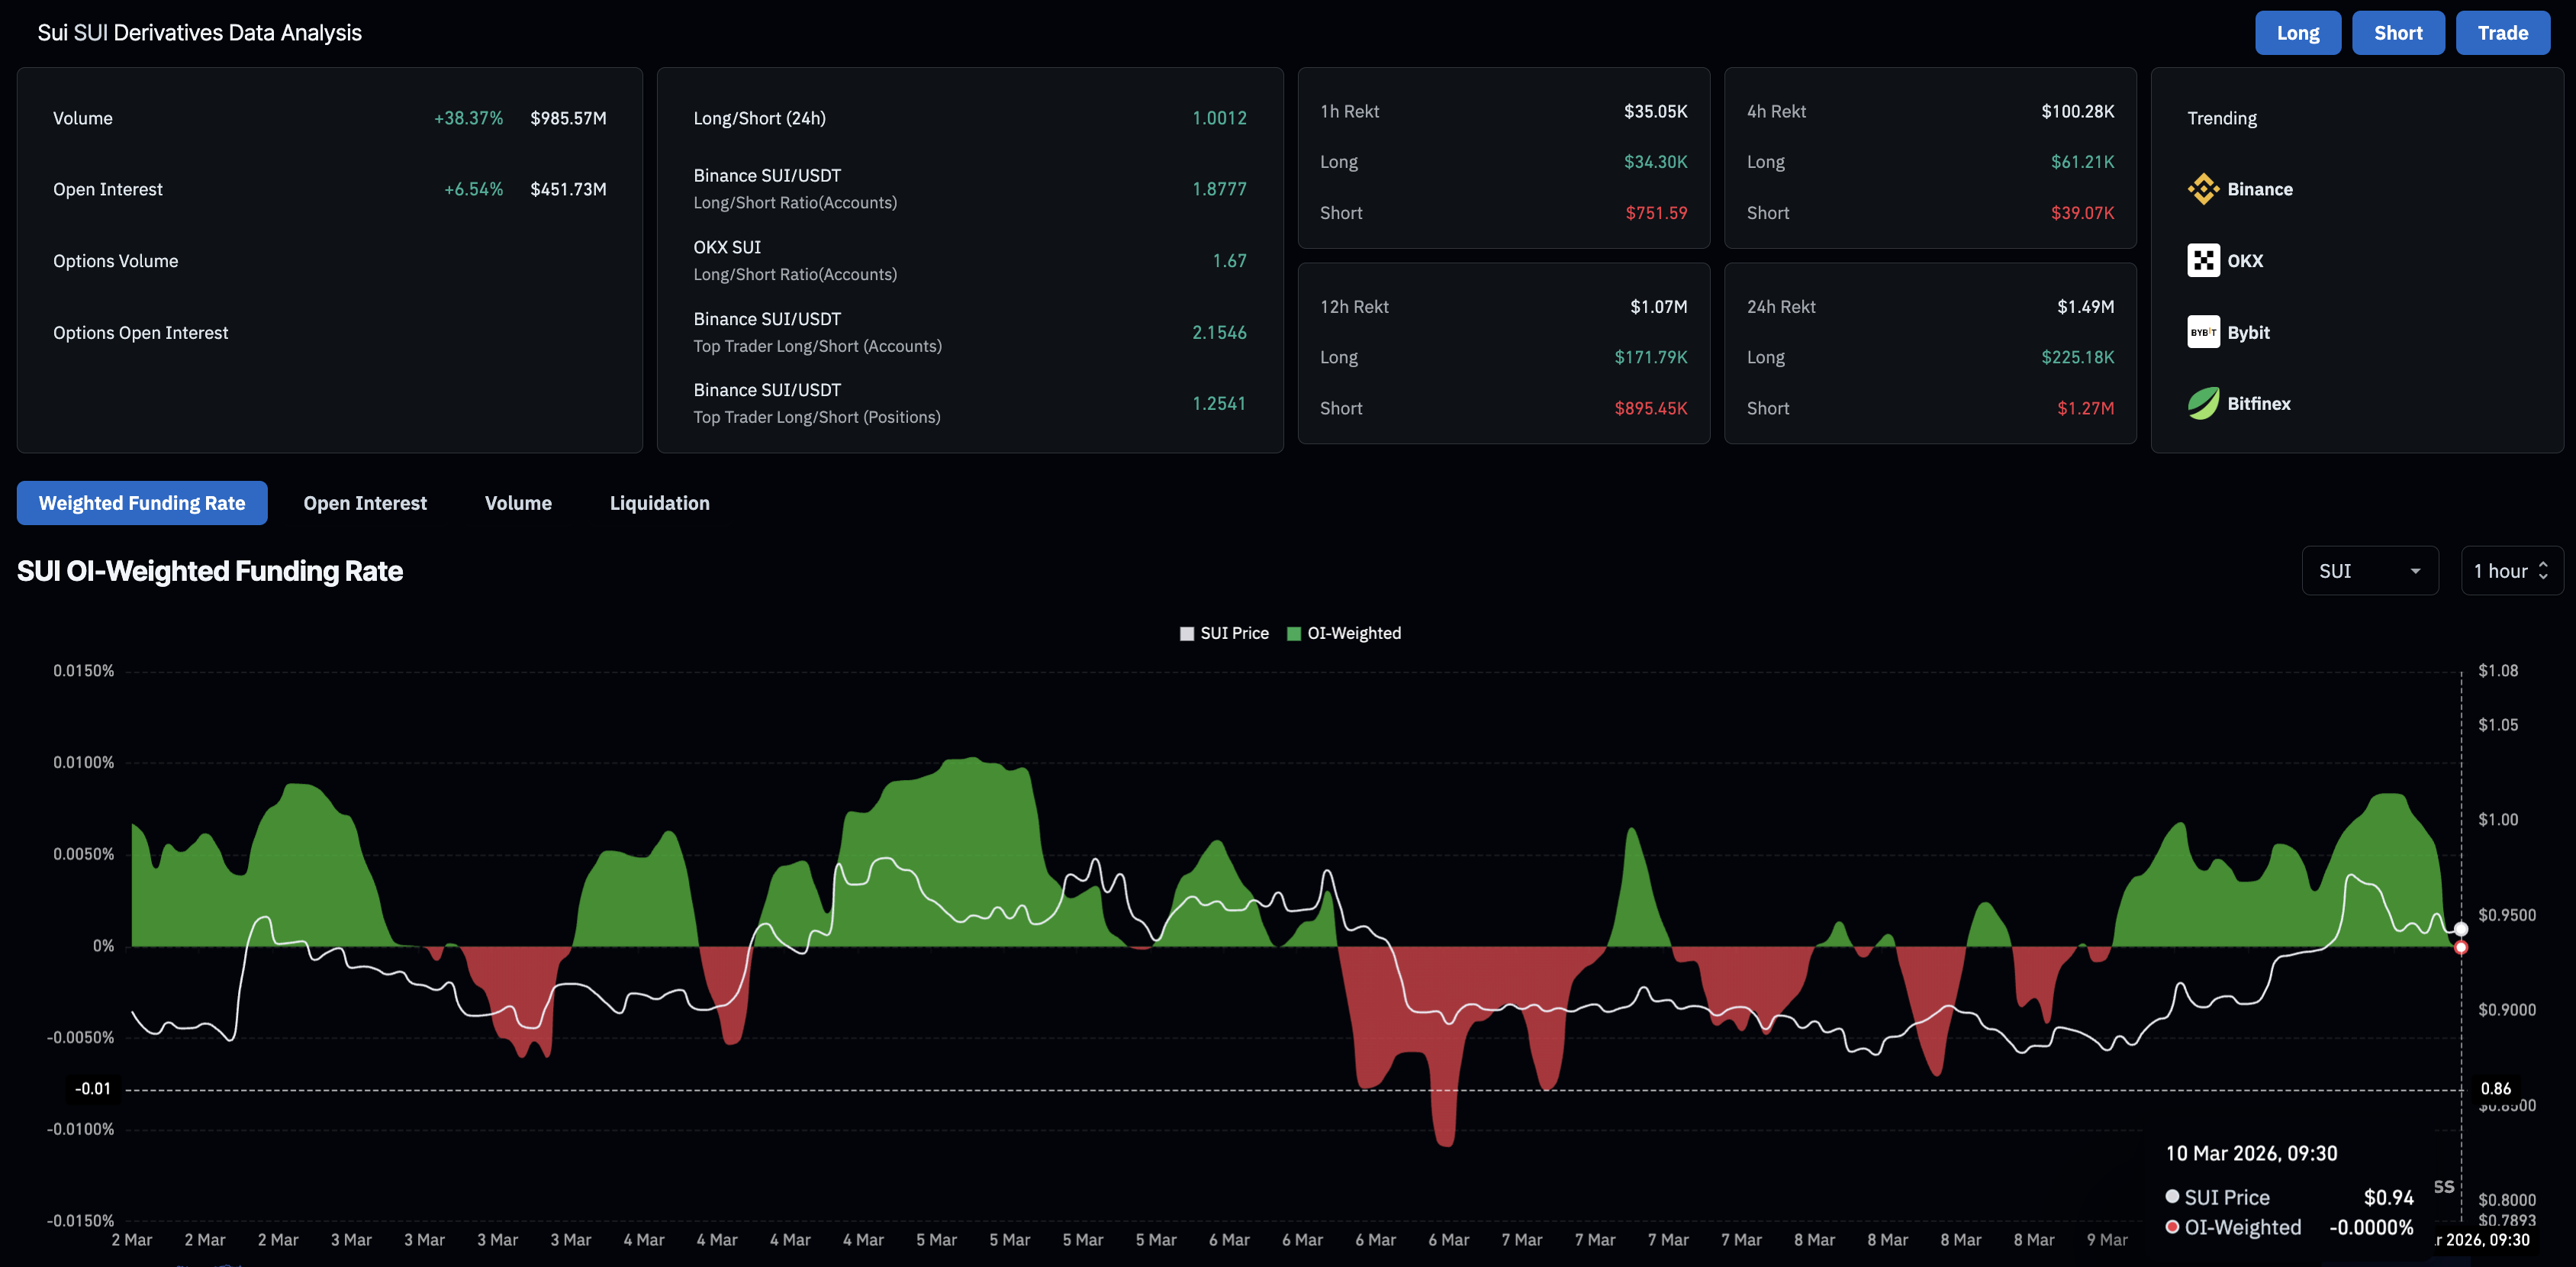
On the derivatives side, retail and whale demand for SUI is scaling higher. CoinGlass data shows that the SUI Open Interest (OI) is at $451.73 million, up more than 6% in the last 24 hours, suggesting positional buildup in the futures market. The long-to-short ratio is close to 1, suggesting roughly an equal number of long and short active positions in SUI futures.
Consistent with the neutral stance, the funding rate is 0%, suggesting an indecisive phase among traders after a short-term bullish bias earlier in the day.
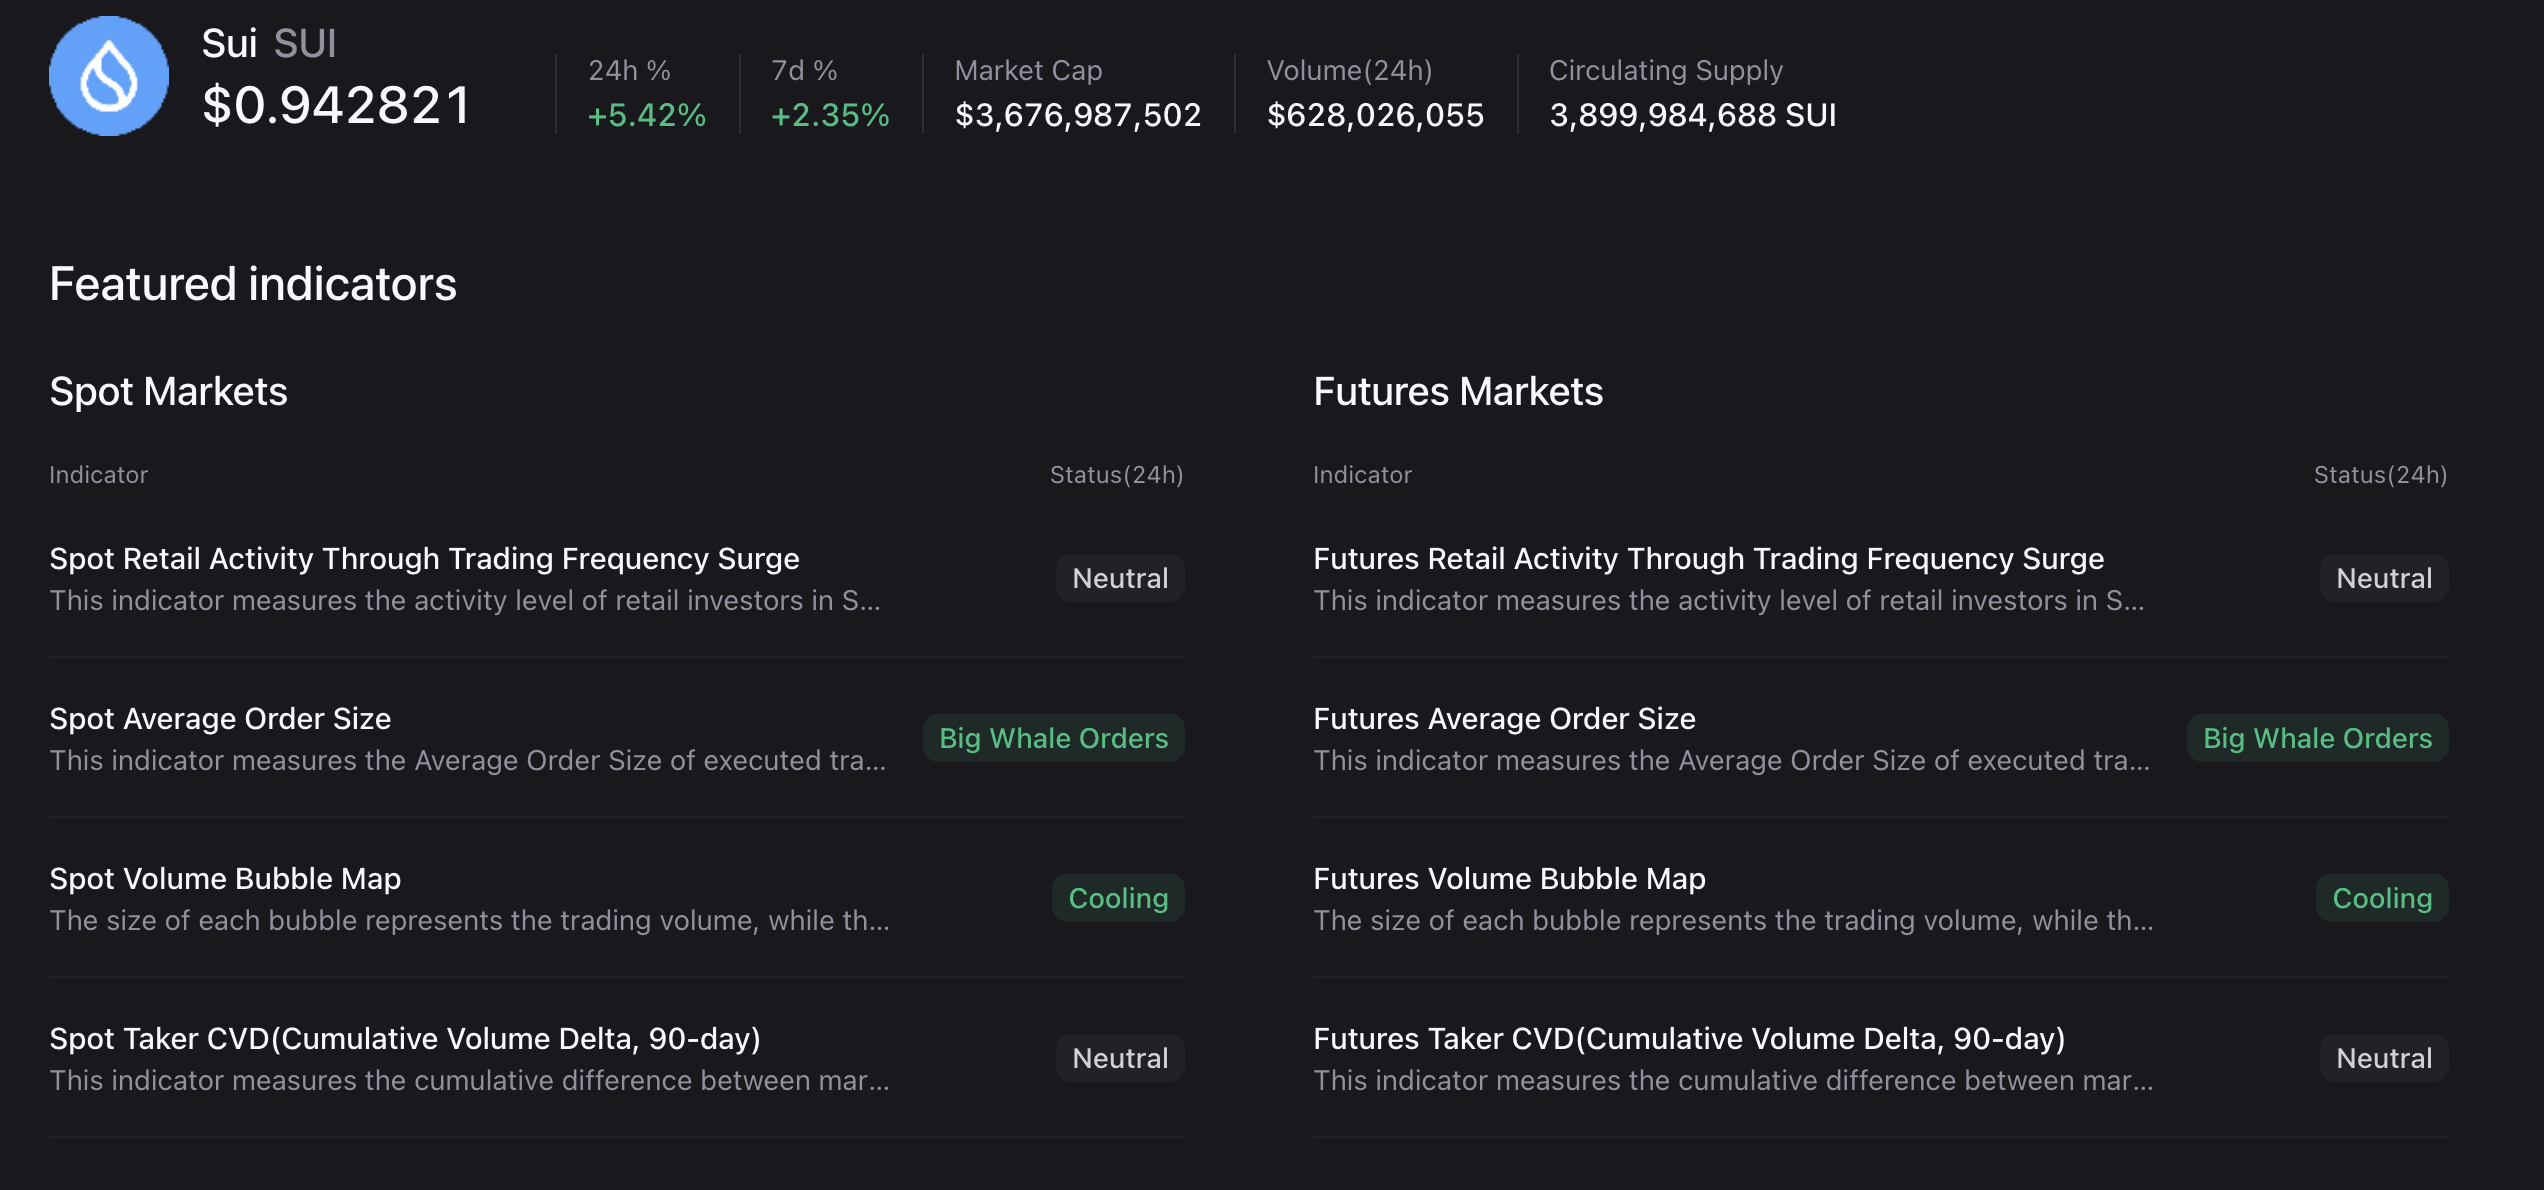
Meanwhile, CryptoQuant data shows an increase in the average order value across futures and spot markets, suggesting renewed whale interest, which often drives sharp moves in either direction.
Technical outlook: Will Sui extend gains above $1?
Sui catapulted 7% on the upside on Monday, after three consecutive days of losses. At the time of writing, it extends gains above $0.9400 on Tuesday, signaling an upward trend in a consolidation range between $0.8836 and $1.0551. These levels coincide with the 100% and 78.6% trend-based Fibonacci retracement levels, respectively, measured between October 13, November 21, and January 6.
The prevailing bias for the layer-1 token remains bearish, as the 50-, 100-, and 200-day EMAs continue to trend downward.
The 50-day EMA at $1.0816 is close to the $1.0551 resistance level, and SUI should secure a daily close above the moving average to confirm the bullish breakout from the consolidation trap. This could open the way to the 50% retracement level at $1.3375, which is close to the 100-day EMA at $1.3614.
The Moving Average Convergence Divergence (MACD) rises modestly above its signal line, inching toward the zero line, hinting at only mild upside momentum as bearish pressure wanes. The Relative Strength Index (RSI) at 48 shows a consistent increase in buying pressure.
On the downside, immediate support sits at $0.8836, where a failure would expose deeper losses toward the 1.272 Fibonacci extension level at $0.7052.
(The technical analysis of this story was written with the help of an AI tool.)
Author

Vishal Dixit
FXStreet
Vishal Dixit holds a B.Sc. in Chemistry from Wilson College but found his true calling in the world of crypto.