Solana Price Forecast: SOL extends winning streak as ETF inflows and bullish derivatives fuel breakout optimism
- Solana price is approaching the upper consolidation range around $92 on Friday, up nearly 10% so far this week.
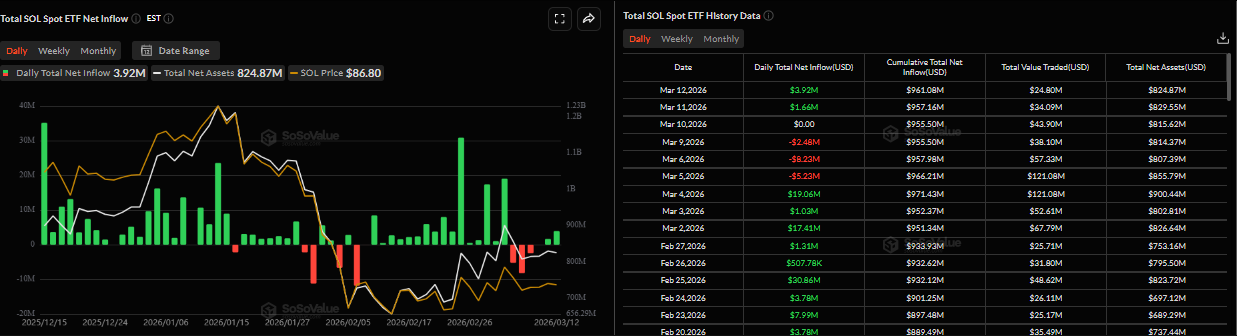
- US-listed spot SOL ETF recorded an inflow of $3.92 million on Thursday, marking the second straight day of positive flows this week.
- The derivatives market supports bullish sentiment amid positive funding rates, and long bets reach a monthly high.

Solana (SOL) price extends its gains on Friday, trading above $89, nearing the upper consolidation range, as bullish momentum builds. Institutional demand for SOL remains strong as spot Exchange Traded funds recorded two straight days of inflows through Thursday, signaling growing investor confidence. In addition, improving sentiment on the derivatives market signals that Solana is gearing up for a potential upside move.
Institutional investors return
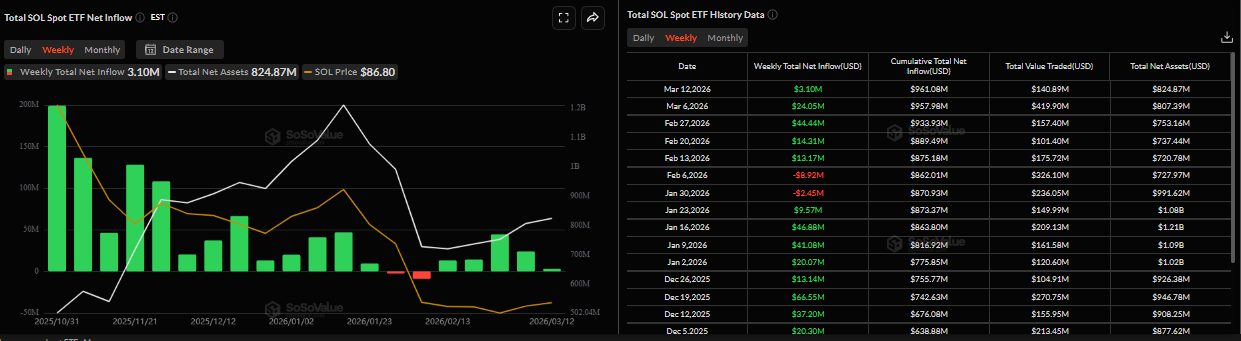
Institutional demand for Solana remains robust so far this week. SoSoValue data shows that spot SOL ETFs recorded an inflow of $3.92 million on Thursday after a $1.66 million inflow the previous day. This institutional demand has remained strong despite the SOL price consolidation, as weekly flows total $3.10 million so far this week, marking the fifth consecutive week of positive flows since February 13. If this inflow trend continues and intensifies, SOL could see an upside move in the upcoming weeks.
Derivatives metrics show bullish bias
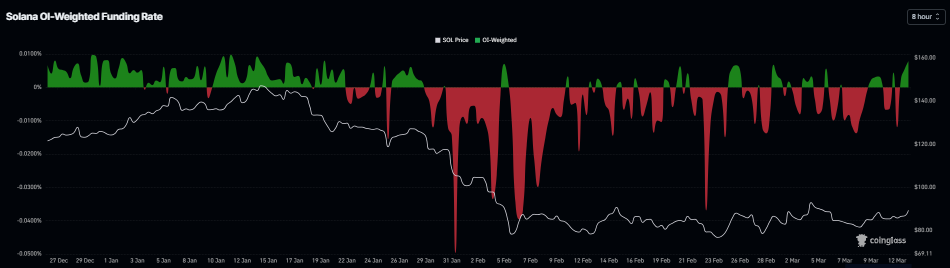
On the derivatives side, CoinGlass funding rates data also shows a positive outlook for Solana. The metric flipped to a positive rate on Thursday, reading 0.0079%, indicating longs are paying shorts and suggesting bullish sentiment toward SOL.
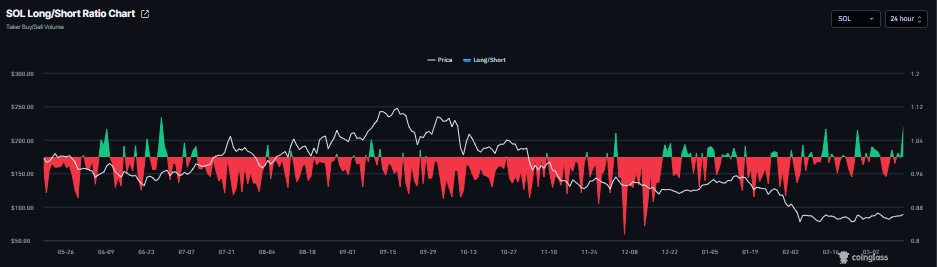
In addition, CoinGlass’s long-to-short ratio for SOL reads 1.07 on Friday, the highest level in over a month. The ratio above one suggests that more traders are betting on Solana’s price to rally.
Solana Price Forecast: SOL bulls aiming for a channel breakout
Solana price is trading above $89 as of writing on Friday, up nearly 10% so far this week. The near-term bias is cautiously bullish as price pushes away from the lower boundary of the descending channel that has capped price between roughly $77 and $92.
The recent rebound unfolds above the 23.6% Fibonacci retracement at $86, measured from the $67 low to the $148 high, as the price nears the upper boundary of consolidation at $92.
The Relative Strength Index (RSI) on the daily chart climbs above 50, signaling improving upside momentum after a prolonged sub-50 phase. The Moving Average Convergence Divergence (MACD) indicator remains in positive territory, with the MACD line above its signal line, reinforcing a recovering bullish pressure despite price remaining well below the falling 50-day and 100-day Exponential Moving Averages (EMAs), which still describe a broader corrective backdrop.
Initial support emerges at the 23.6% retracement near $86, with the channel floor around $77 following below as a key level that would need to hold to preserve the nascent recovery structure.
On the topside, immediate resistance aligns at the channel top near $92, ahead of the horizontal barrier at $120, where the declining EMAs converge to form a broader resistance zone. A close above $92 would open the way toward the 38.2% retracement at $98, while sustained trading back below $86 would weaken the current bullish bias and refocus attention on the recent lows toward $77.
(The technical analysis of this story was written with the help of an AI tool.)
Author

Manish Chhetri
FXStreet
Manish Chhetri is a crypto specialist with over four years of experience in the cryptocurrency industry.




