Shiba Inu Price Forecast: SHIB stalls as rising supply on exchanges warns of profit-taking
- Shiba Inu hovers above a crucial psychological zone, sustaining August’s 7% gains.
- On-chain data shows rising supply on exchanges hits an annual high, pointing to alarming odds of profit-taking.
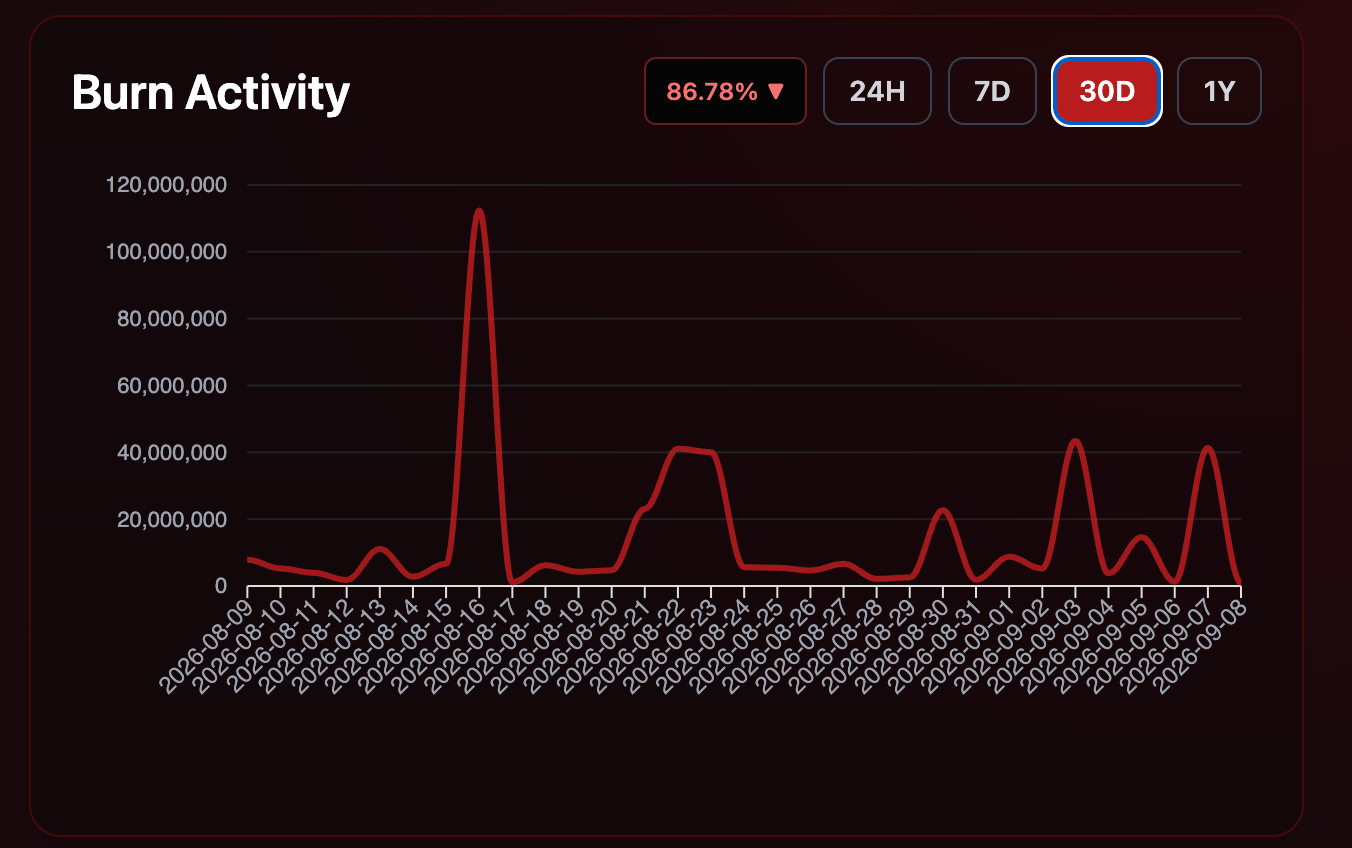
- Shiba Inu burned 41.35 million SHIB tokens on Monday, reflecting efforts to reduce inflation.

Shiba Inu (SHIB) stalls above $0.00000500 on Tuesday, following two consecutive bullish months as upside momentum eases. Volatile investors' interest in the meme coin amid rising supply on exchanges warns of profit-taking despite consistent token burns.
Exchange deposits hit fresh highs amid consistent token burns
Shiba Inu burned 41.35 million SHIB tokens on Monday, following the 43.43 million tokens burned on Thursday, reflecting a steady approach to controlling token inflation. Despite the burns, SHIB stalls and lacks momentum to extend its uptrend as the broader market's shift toward privacy coins lowers the recovery odds for speculation-driven meme coins.
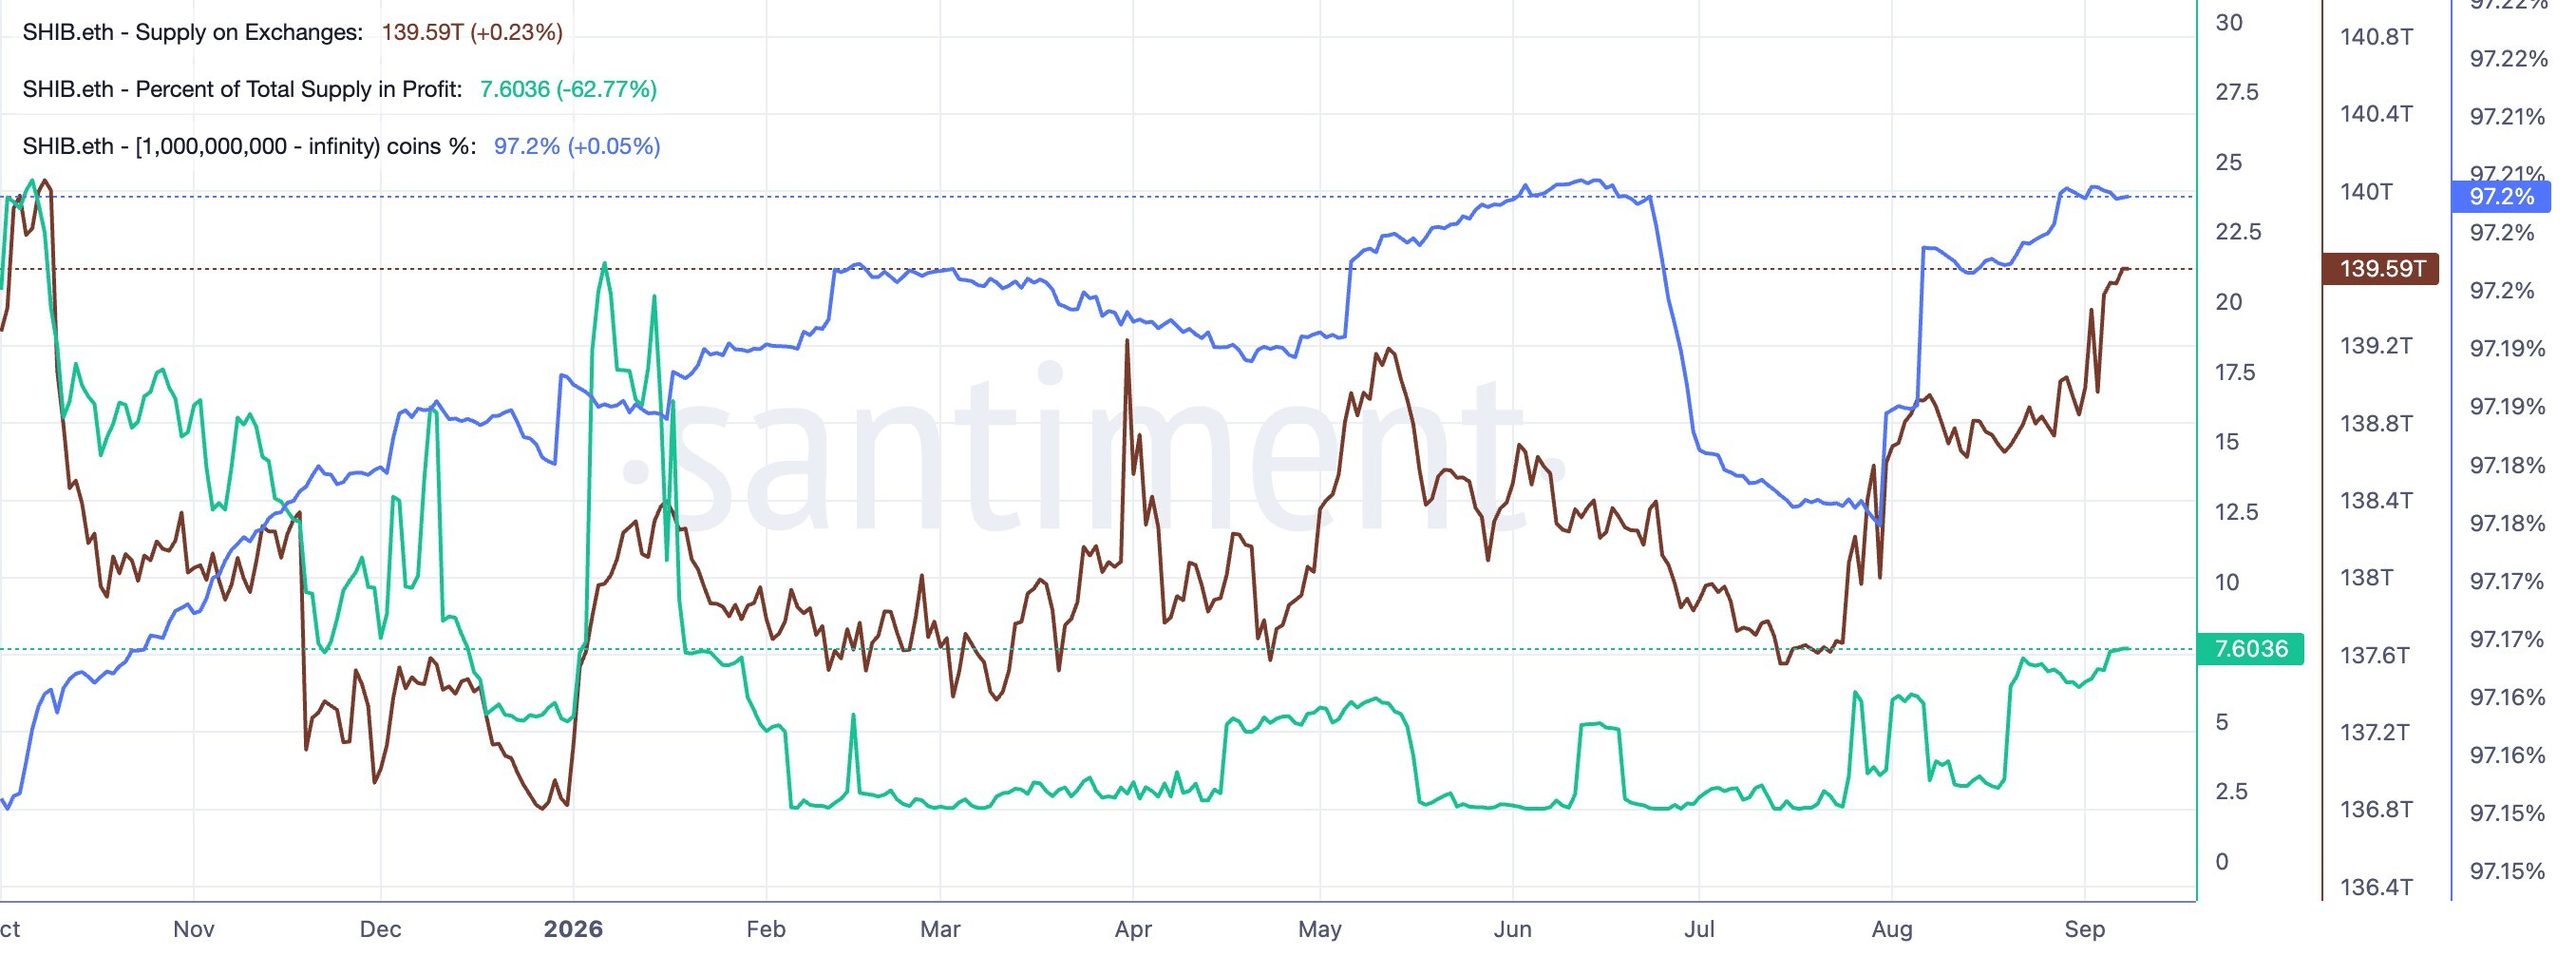
On-chain data supports the possibility of reduced investor demand amid rising deposits on crypto exchanges. Shiba Inu supply on exchanges stands at 139.59 trillion SHIB, up from 137.66 trillion SHIB on July 24.
At the same time, the SHIB supply in profit stands at 7.60%, the highest in eight months, suggesting a higher likelihood of long-trapped investors booking profits.
Technical outlook: Could SHIB extend its rally?
Shiba Inu edges lower on Tuesday, following a bearish close the previous day. From a technical perspective, SHIB remains capped under an ascending resistance trendline connecting the highs of July 26 and August 21, near the May 11 high at $0.00000670.
The meme coin also holds above the 50% retracement level of the downswing from $0.00000670 to $0.00000405, at $0.00000521, reaffirming a broadly neutral near-term bias. Immediate resistance for SHIB aligns with the 78.6% Fibonacci retracement at $0.00000602.
The Relative Strength Index (RSI) near 55 points to balanced momentum, and the flat Moving Average Convergence Divergence (MACD) line close to its signal line underscores the absence of a clear directional impulse.
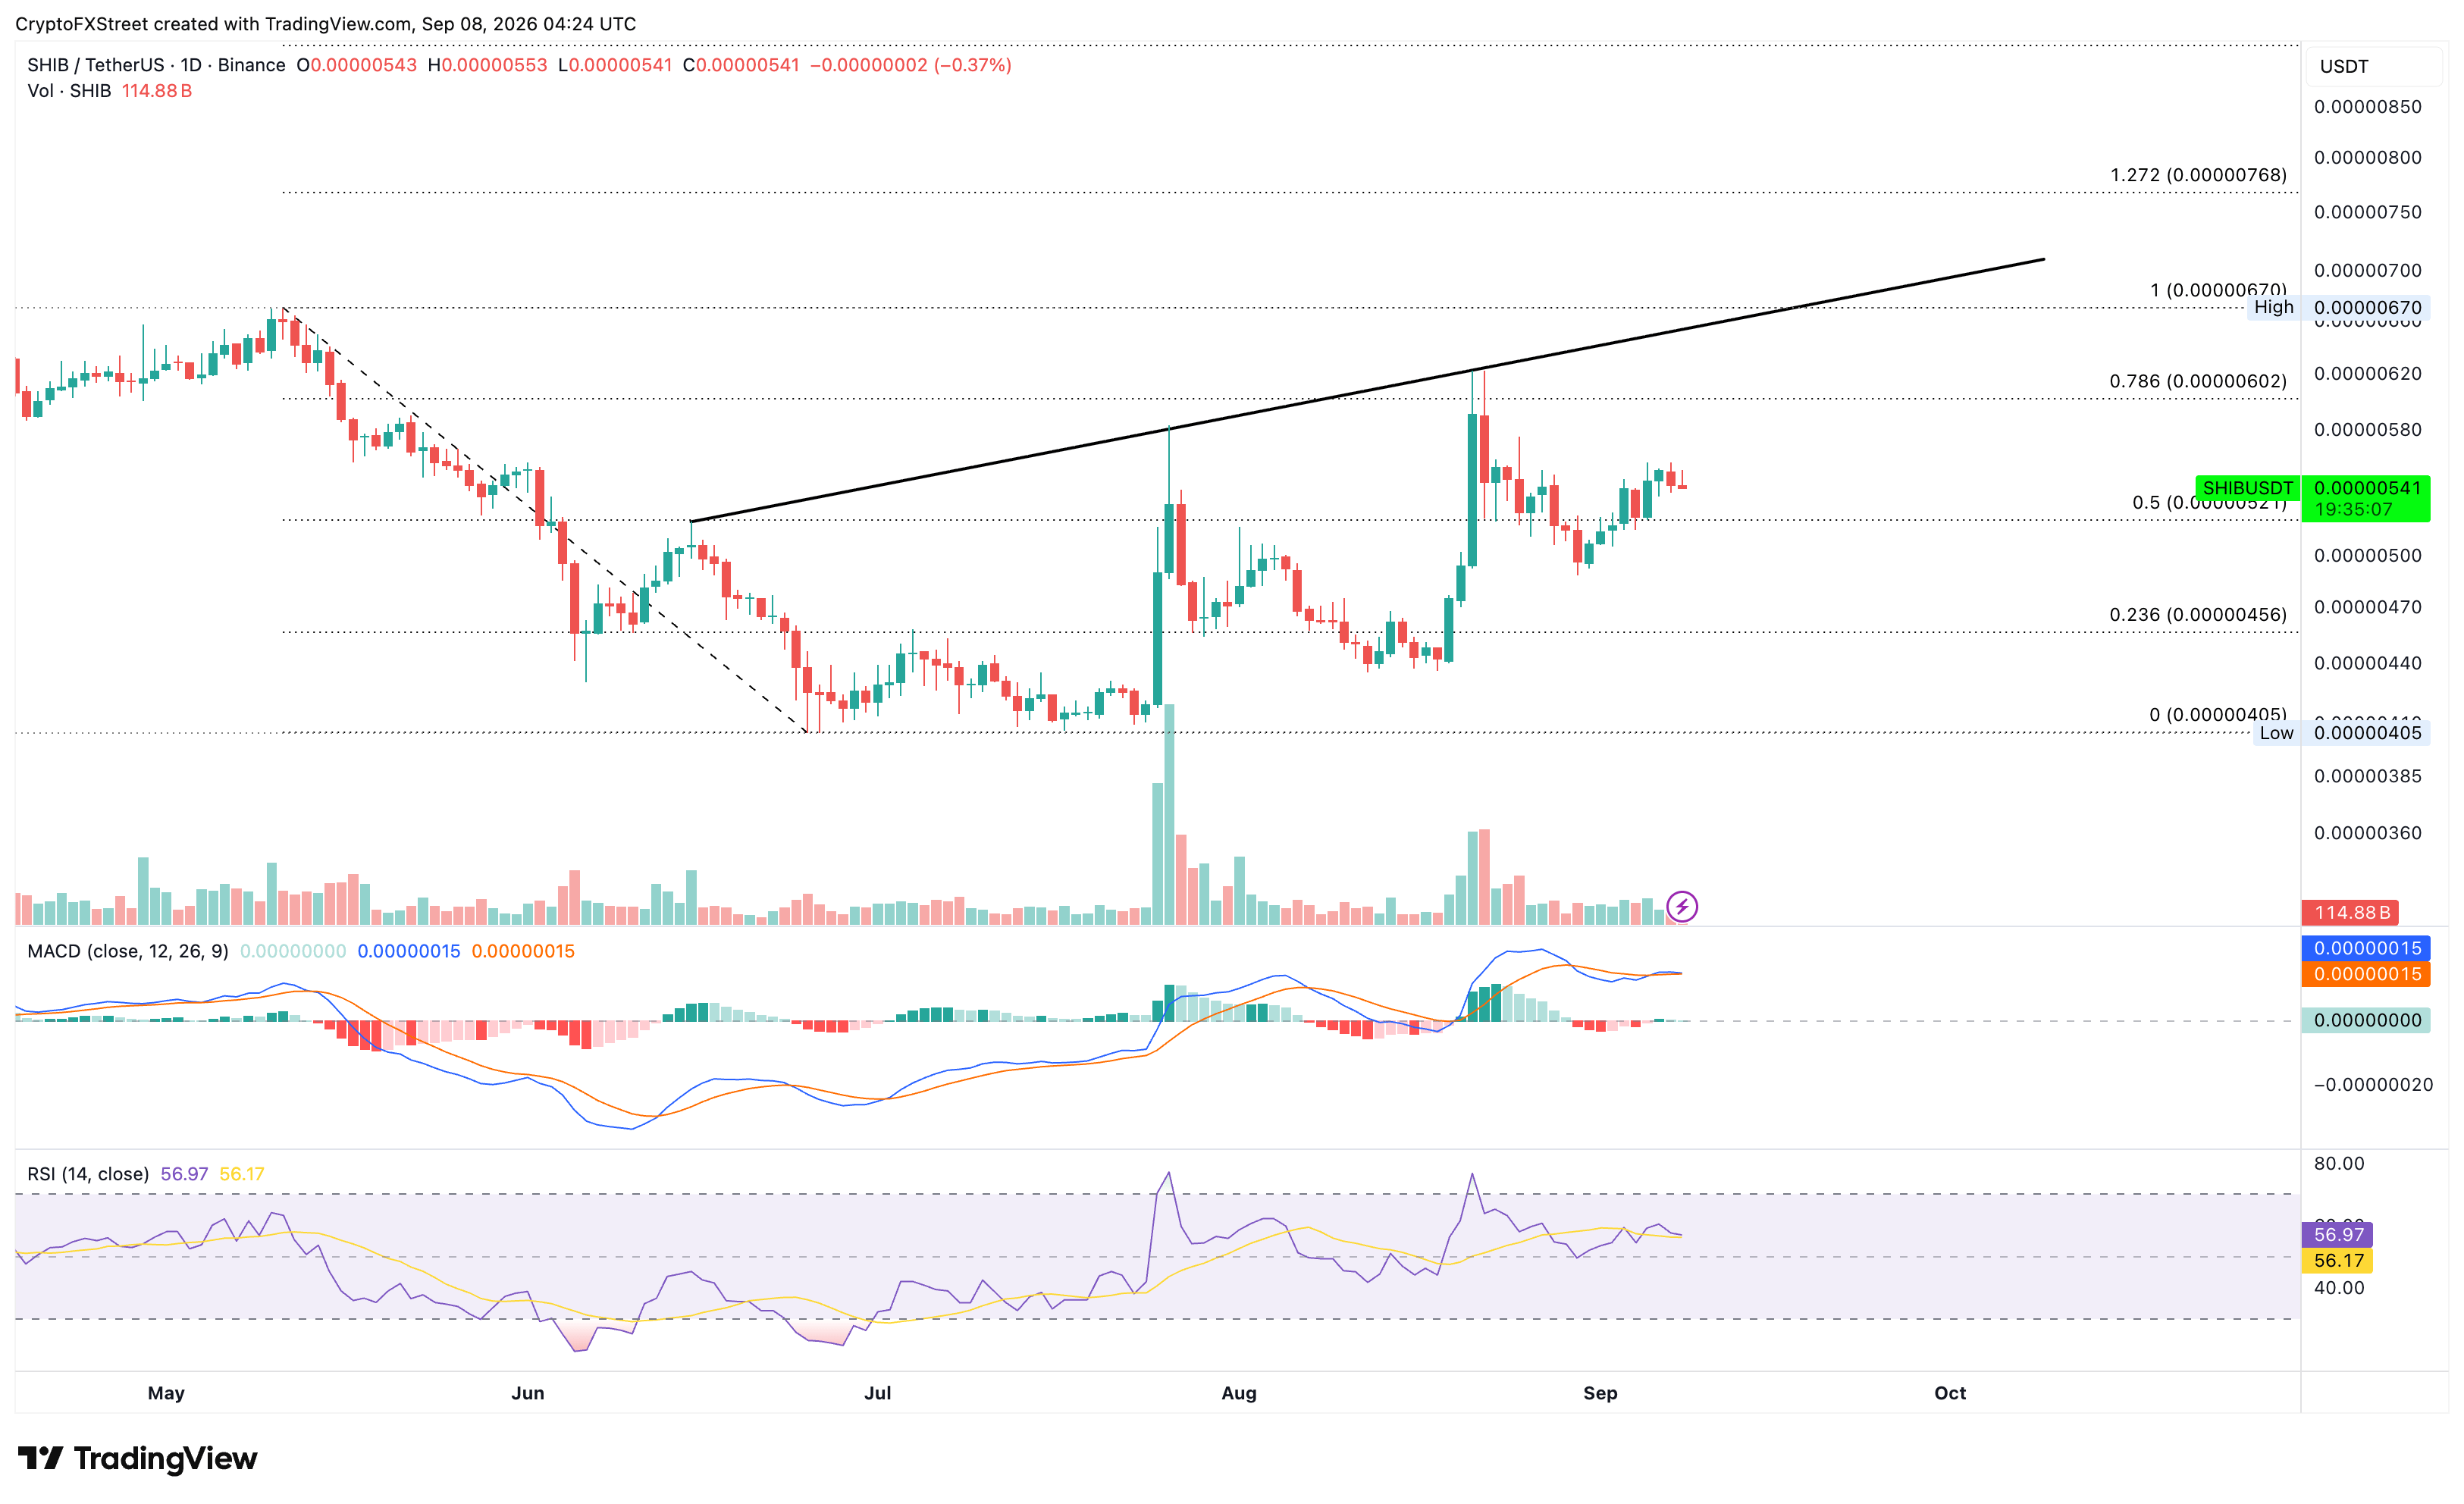
Looking down, the 50% retracement level at $0.00000521 serves as the immediate support, followed by the 23.6% Fibonacci retracement level at $0.00000456.
(The technical analysis of this story was written with the help of an AI tool. Know more.)
Author

Vishal Dixit
FXStreet
Vishal Dixit holds a B.Sc. in Chemistry from Wilson College but found his true calling in the world of crypto.



