Bitcoin vs Gold: BTC ticks up near $82K, XAU tests $4,000 as US S&P Services PMI eases
- Bitcoin builds momentum near $82,000, with the 59-day EMA providing short-term support.
- Gold falls below $4,000, weighed down by weakening momentum indicators and rising geopolitical tensions.
- US S&P Global Services PMI eases to 57.9 in October, down from September’s 58.8.

Cryptocurrency prices are broadly rising on Friday, led by Bitcoin (BTC) as it approaches the immediate resistance at $82,000. The path of least resistance appears upward, supported by solid structural support levels.
A daily close above $82,000 would reinforce the short-term bullish outlook, raising recovery odds toward $84,000 in the short term and $87,000 in the medium term.
Gold (XAU), meanwhile, trades under intense sell-side pressure, with the pivotal $4,000 still holding as support. The metal reflects fading investor interest and declining risk appetite as the Middle East stares at the possibility of a renewed war between the United States (US) and Iran.
US S&P Global Services PMI eases in October
Business activity in the United States (US) private sector continued to expand in October, according to preliminary data S&P Global released on Friday.
The S&P Global Manufacturing Purchasing Managers' Index (PMI) came in at 56 in October, up from 55.9 in September and above market expectations of 55.6. Meanwhile, the Services PMI came in line with forecasts at 57.9, down from 58.8 in September.
The Composite PMI, which combines manufacturing and services activity, eased to 57.6 in October, from 58.4 in the previous month.
The report comes ahead of the Federal Reserve (Fed) rate decision on Wednesday. The CME FedWatch Tool shows a near 90% chance the central bank will keep interest rates unchanged in the 3.75-4.00% range. Only 10.5% of interest rate traders anticipate a rate hike.
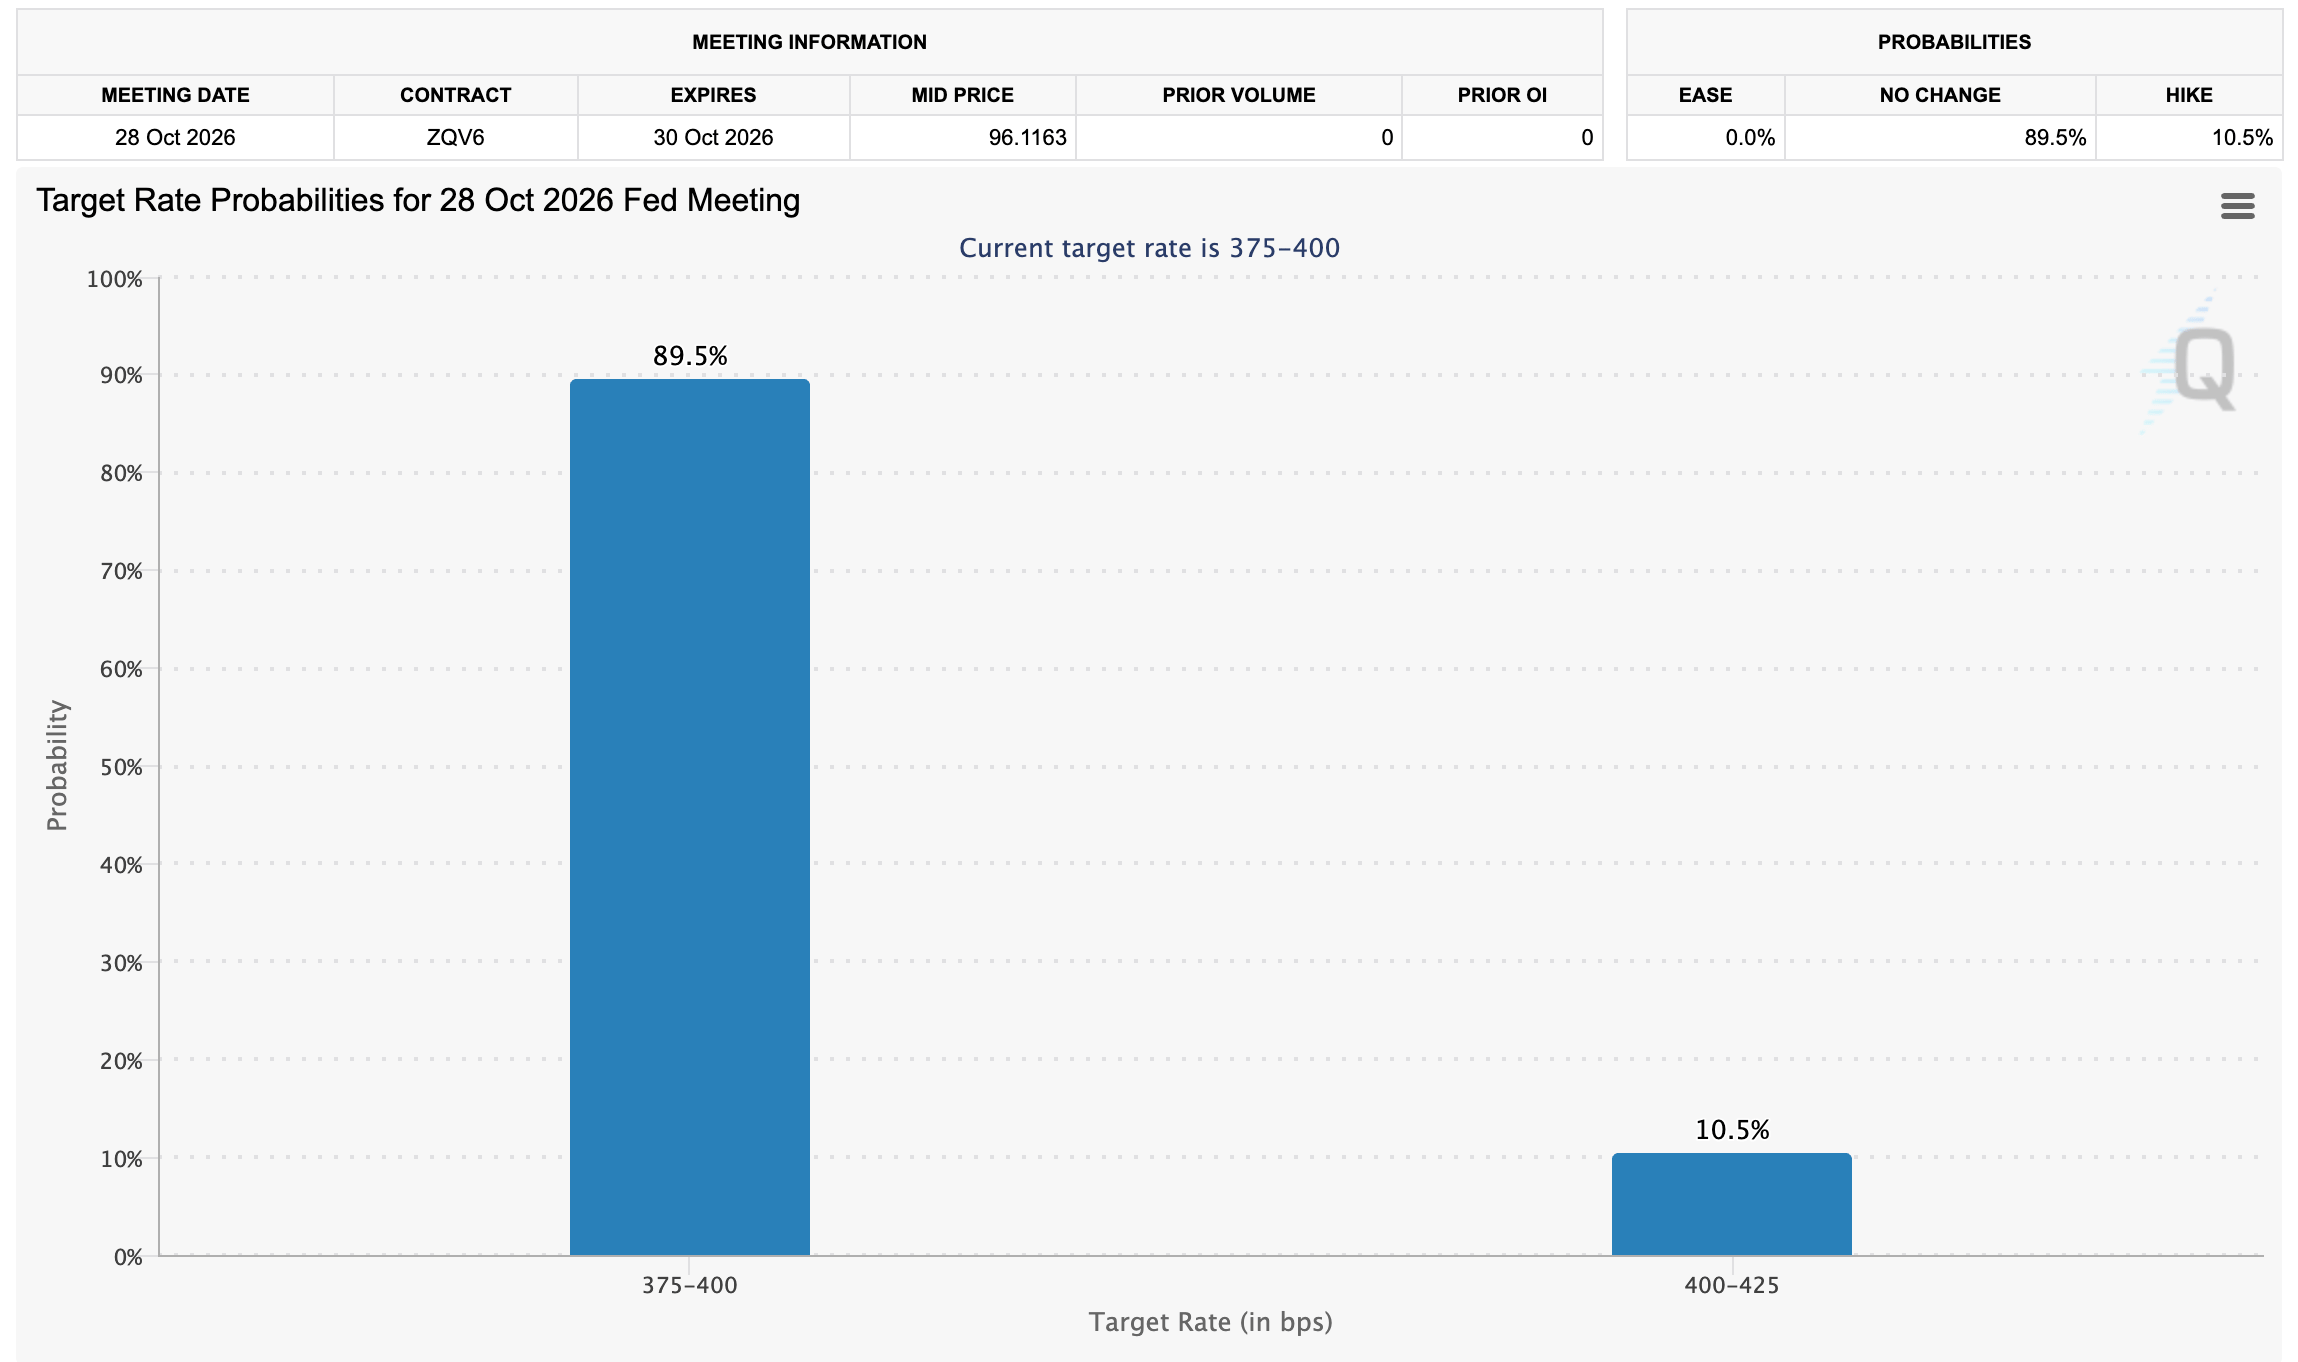
Despite rising geopolitical tensions driving Oil prices higher, with West Texas Intermediate (WTI) trading above $101.00 on Friday, the US economy has continued to show resilient activity. Wednesday’s meeting outcome will shape the outlook toward year-end, even as market participants price in higher odds of a December rate hike.
“The FOMC meets 27-28 October, with the decision on Wednesday, 28 October. With inflation risk still elevated but risk assets already tightening financial conditions themselves, the market will be watching closely for any shift in the Fed's reaction function,” Crypto Finance said in an emailed analysis report.
Technical analysis: Bitcoin bulls stage a comeback
Bitcoin trades at $81,988, extending its recovery above a dense layer of moving average support and sustaining a constructive near-term bias. Price holds above the 50-day Exponential Moving Average (EMA) at $80,884, while the 100-day and 200-day EMAs at $77,532 and $76,184 reinforce the broader bullish structure.
The SuperTrend line at $79,664 sits well below spot, suggesting downside attempts remain buffered, although the Relative Strength Index (RSI) near 48 signals neutral momentum and the negative Moving Average Convergence Divergence (MACD) reading hints that upside traction is moderating rather than accelerating.
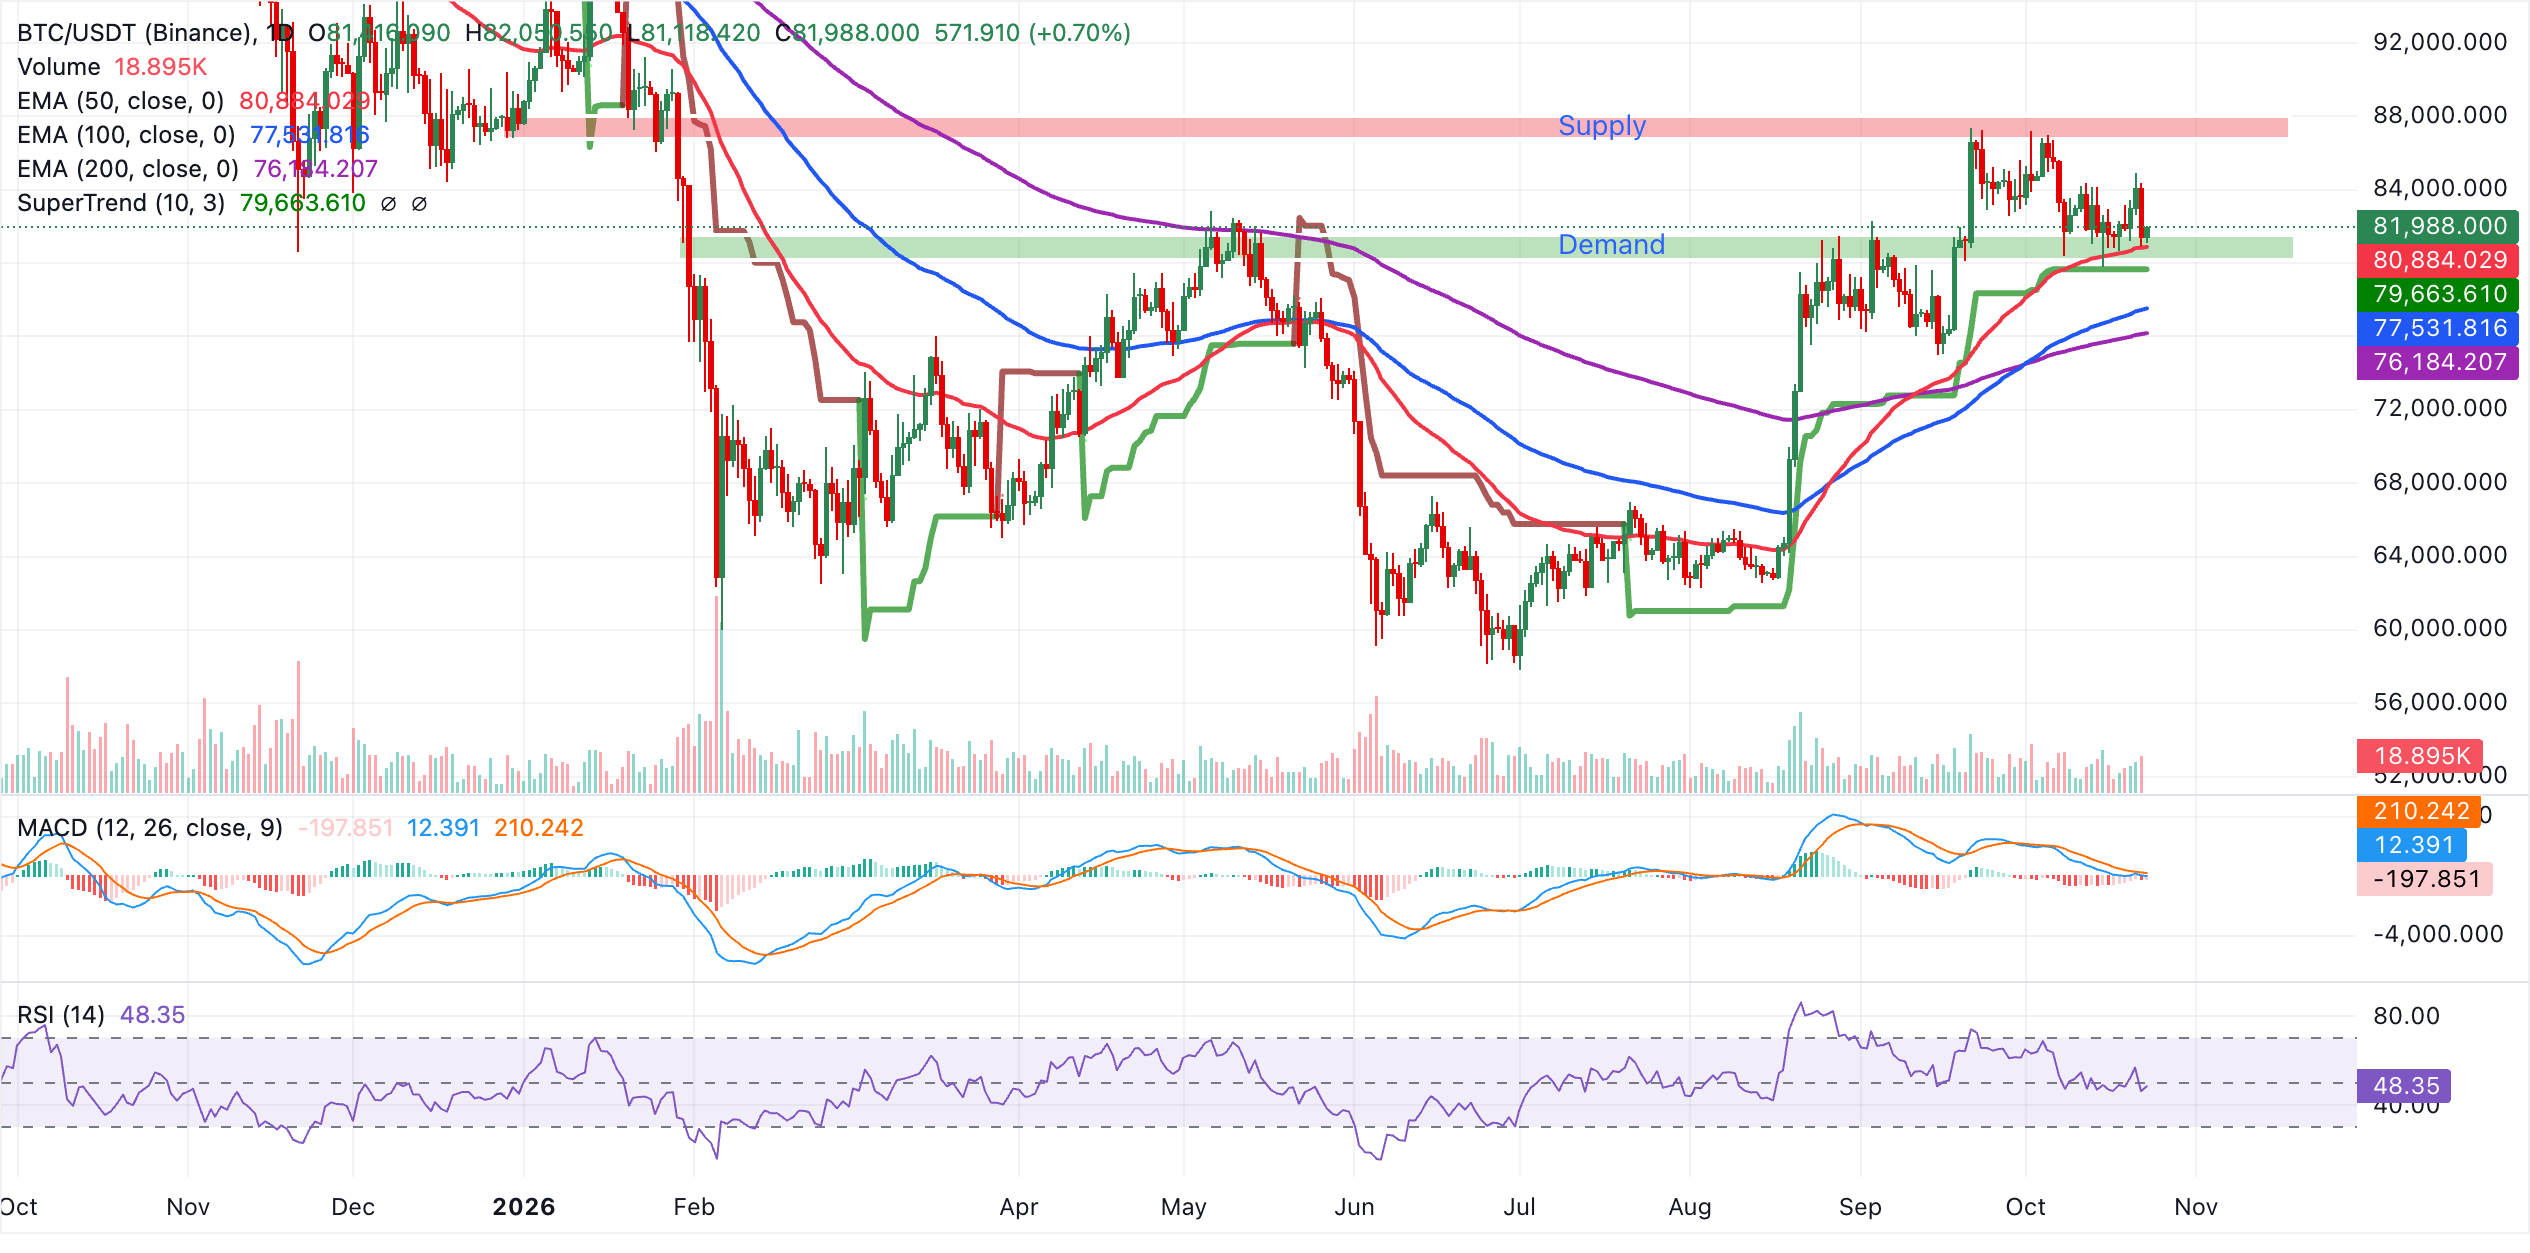
Immediate support lies at the 50-day EMA around $80,884, followed by the SuperTrend baseline near $79,664, which marks the next technical floor should a deeper pullback unfold. Below these, the 100-day EMA at $77,532 and the 200-day EMA at $76,184 define a broader demand zone that would need to hold to preserve the prevailing bullish bias. A daily close under this cluster would materially weaken the trend and open the door to a more pronounced corrective phase.
Gold technical analysis: XAU trades under pressure
Gold trades at $4,019, keeping a bearish near-term tone as it holds beneath the downward trendline resistance at $4,091 and a dense cluster of EMAs and the SuperTrend indicator stacked overhead.
The 50-day, 100-day and 200-day EMAs at $4,224, $4,284 and $4,287 respectively, together with the SuperTrend line at $4,223, suggest that Gold remains under firm technical pressure, while the RSI near 35 points to weak momentum rather than an oversold washout, leaving room for further downside before buyers are forced back in.
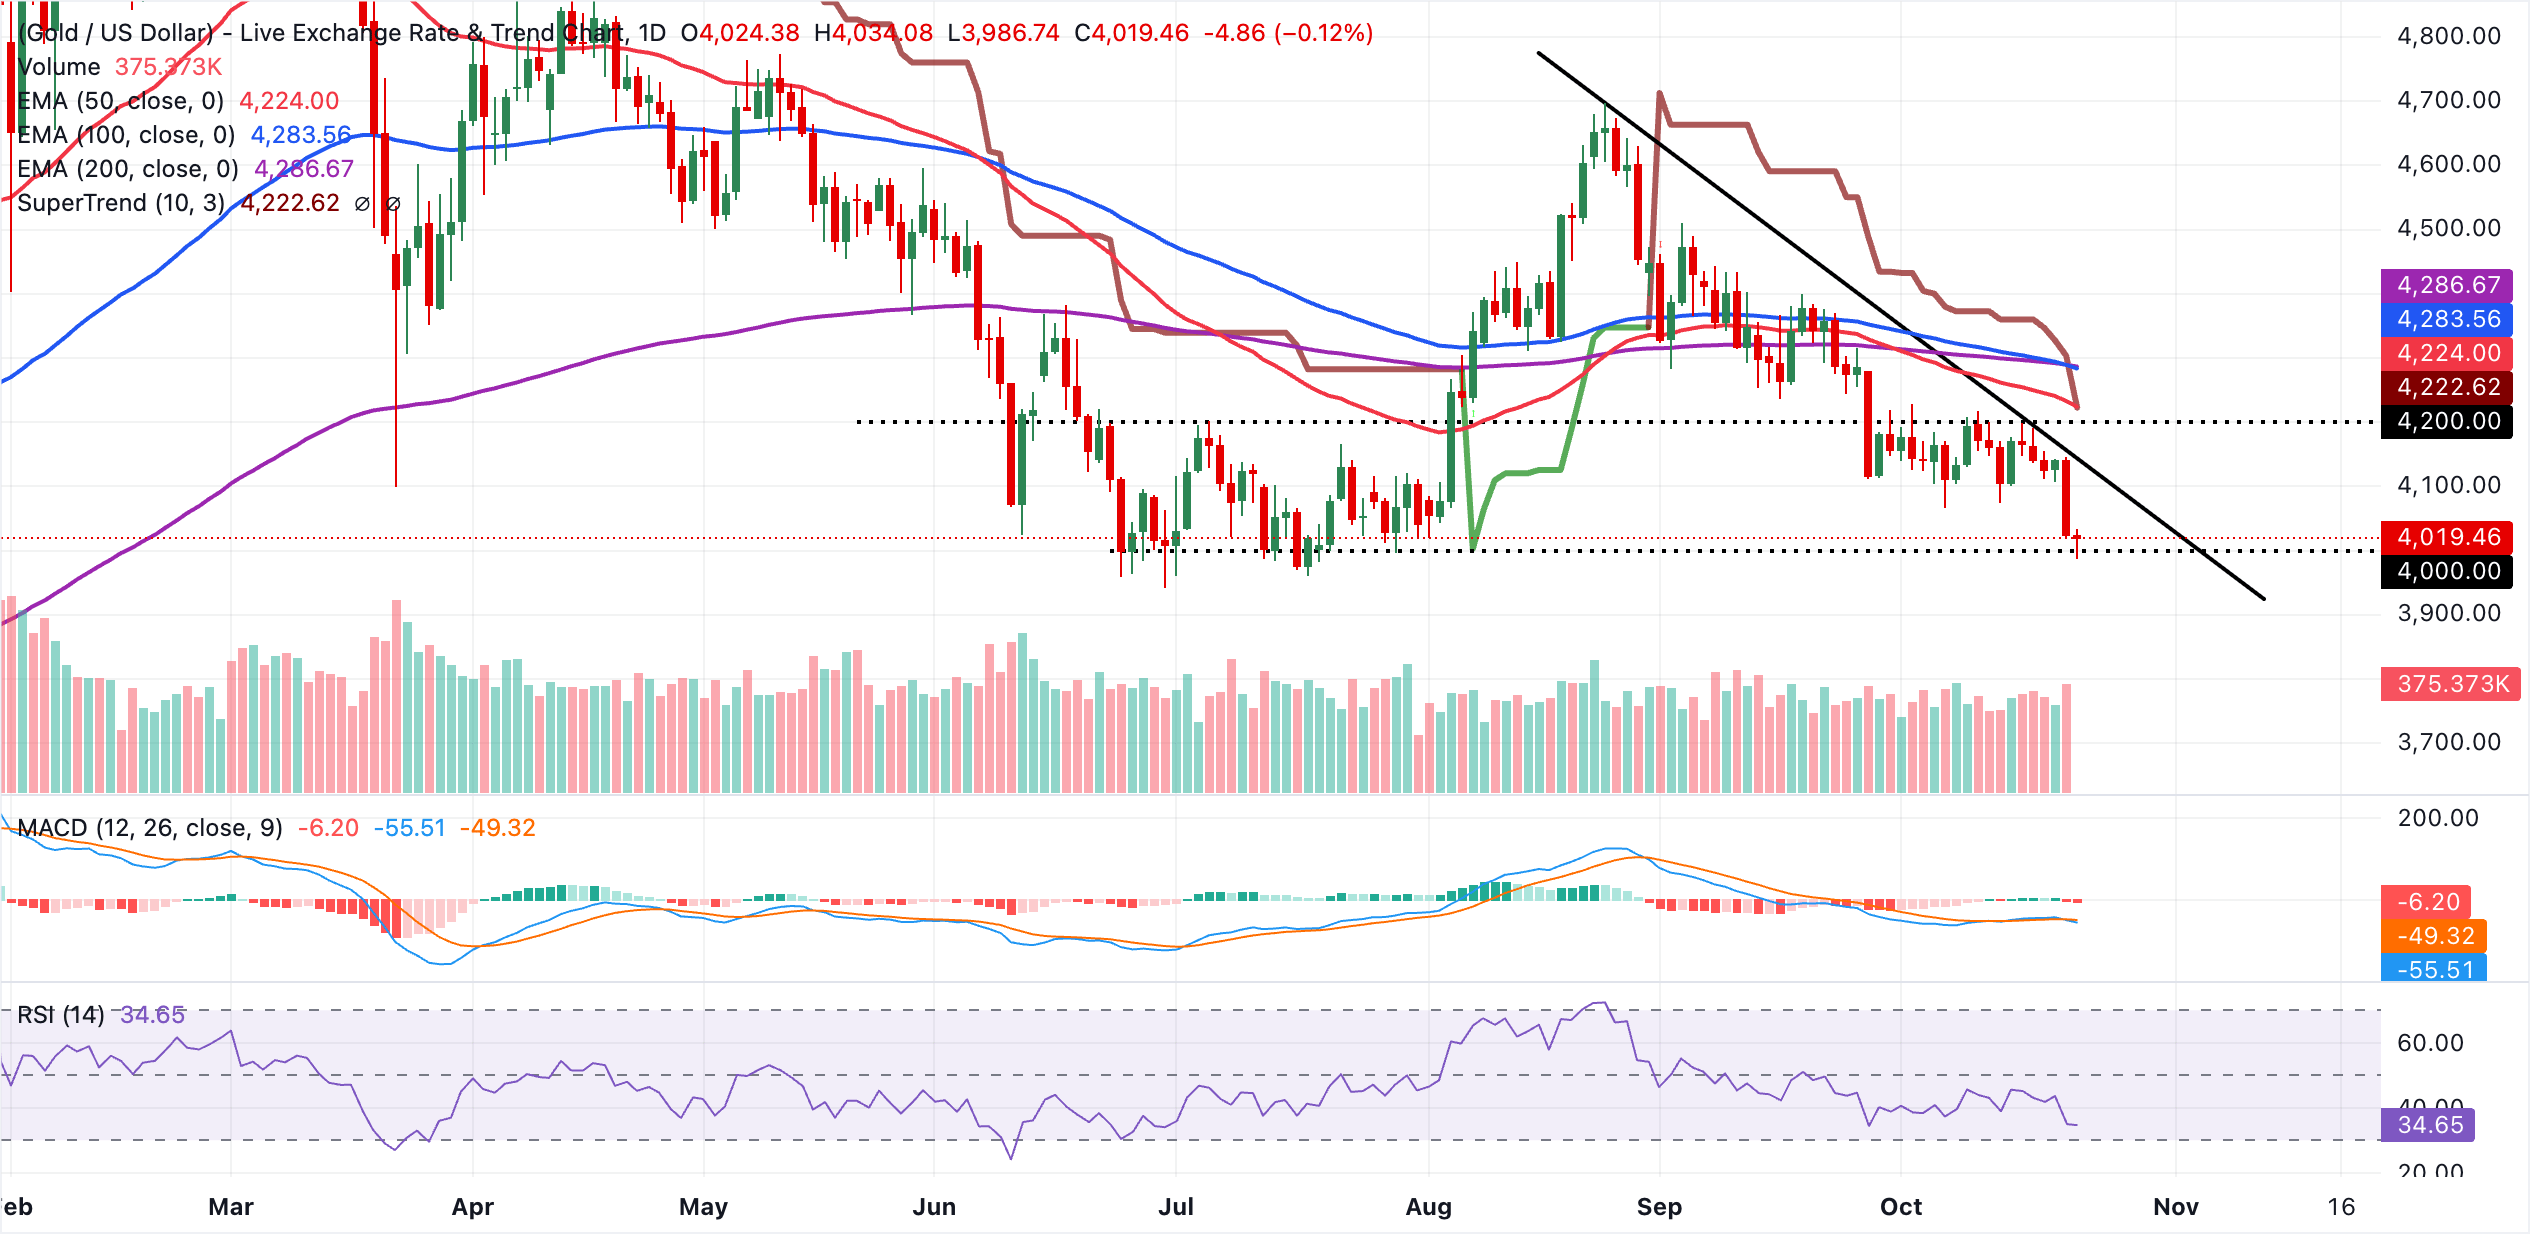
Initial resistance lies at the broken trendline level around $4,091, ahead of the SuperTrend barrier near $4,223 and the 50-day EMA at $4,224. A sustained recovery above these would be needed to challenge the 100-day and 200-day EMAs clustered just below $4,290, where the broader bearish structure would begin to erode.
With no clear structural support levels on the daily chart, any fresh decline would likely search for new demand zones, while the MACD indicator turning more negative again reinforces the idea that rallies into the mentioned resistance band are likely to attract selling interest.
(The technical analysis of this story was written with the help of an AI tool. Know more.)
Bitcoin, altcoins, stablecoins FAQs
Bitcoin is the largest cryptocurrency by market capitalization, a virtual currency designed to serve as money. This form of payment cannot be controlled by any one person, group, or entity, which eliminates the need for third-party participation during financial transactions.
Altcoins are any cryptocurrency apart from Bitcoin, but some also regard Ethereum as a non-altcoin because it is from these two cryptocurrencies that forking happens. If this is true, then Litecoin is the first altcoin, forked from the Bitcoin protocol and, therefore, an “improved” version of it.
Stablecoins are cryptocurrencies designed to have a stable price, with their value backed by a reserve of the asset it represents. To achieve this, the value of any one stablecoin is pegged to a commodity or financial instrument, such as the US Dollar (USD), with its supply regulated by an algorithm or demand. The main goal of stablecoins is to provide an on/off-ramp for investors willing to trade and invest in cryptocurrencies. Stablecoins also allow investors to store value since cryptocurrencies, in general, are subject to volatility.
Bitcoin dominance is the ratio of Bitcoin's market capitalization to the total market capitalization of all cryptocurrencies combined. It provides a clear picture of Bitcoin’s interest among investors. A high BTC dominance typically happens before and during a bull run, in which investors resort to investing in relatively stable and high market capitalization cryptocurrency like Bitcoin. A drop in BTC dominance usually means that investors are moving their capital and/or profits to altcoins in a quest for higher returns, which usually triggers an explosion of altcoin rallies.
Author

John Isige
FXStreet
John Isige is a seasoned cryptocurrency journalist and markets analyst committed to delivering high-quality, actionable insights tailored to traders, investors, and crypto enthusiasts. He enjoys deep dives into emerging Web3 tren



