Ripple's XRP technical analysis: XRP/USD can not deal with stubborn $0.4000 sellers
- Ripple's XRP price is trading marginally in the red, down around 1% in the second half of the session on Friday.
- XRP/USD via the daily chart view despite the minor losses, sees a bullish technical set up, pennant structure subject to a breakout.
- The price has struggled to retain the $0.4000 price territory this week, as heavy sellers remain camped in the area.

Spot rate: 0.3961
Relative change: -0.95%
High: 0.4007
Low: 0.3915
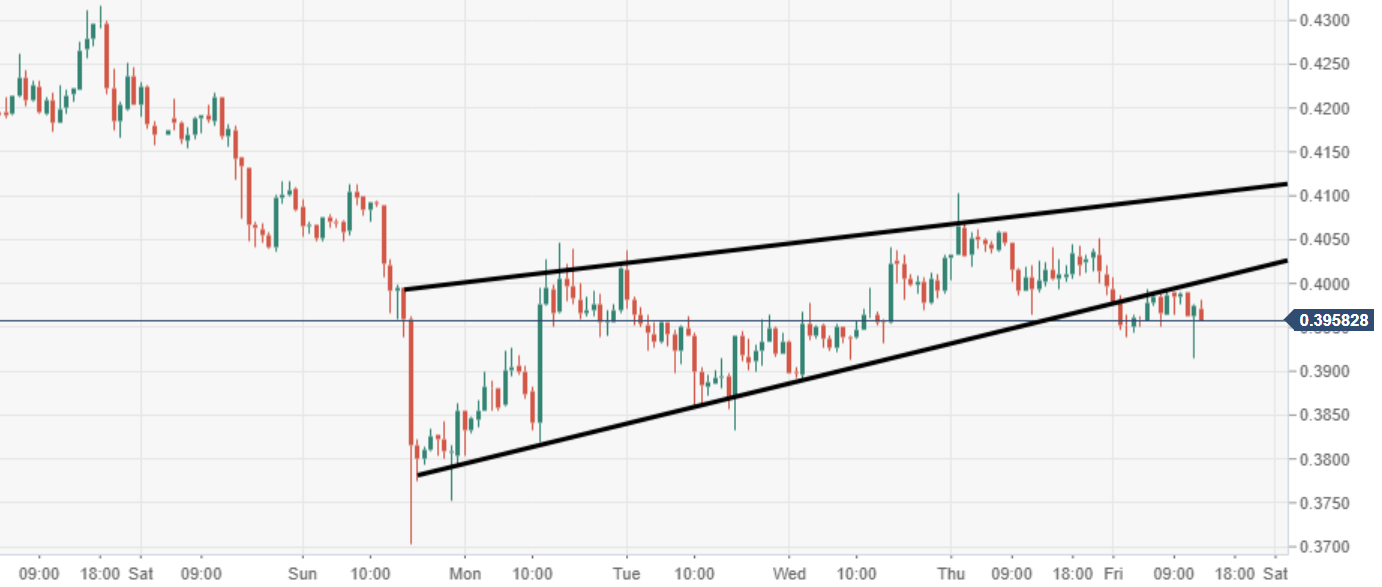
XRP/USD 60-minute chart
- Price action via the 60-minute chart view has broken out to the downside from a rising wedge pattern formation.
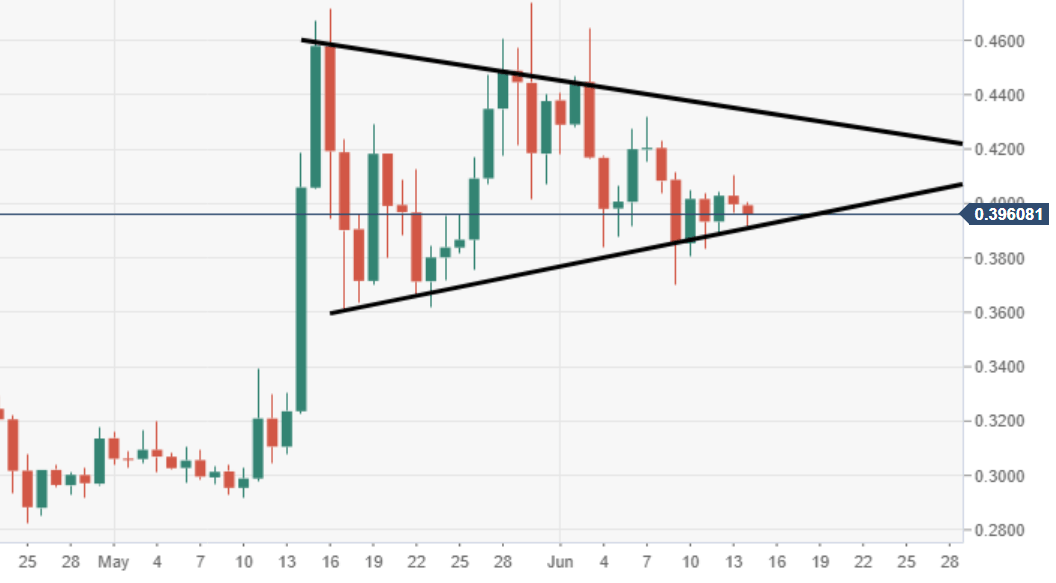
XRP/USD daily chart
- XRP/USD daily price action is moving within a bullish pennant pattern formation, something which is seen with some of its peers also.
Author

Ken Chigbo
Independent Analyst
Ken has over 8 years exposure to the financial markets. He started his career as an analyst, covering a variety of asset classes; forex, fixed income, commodities and equities.
More from Ken Chigbo


