Ripple Technical Analysis: XRP looks south, 100-DMA guards the immediate downside
- XRP/USD returns to the red after rejection again above 0.2450.
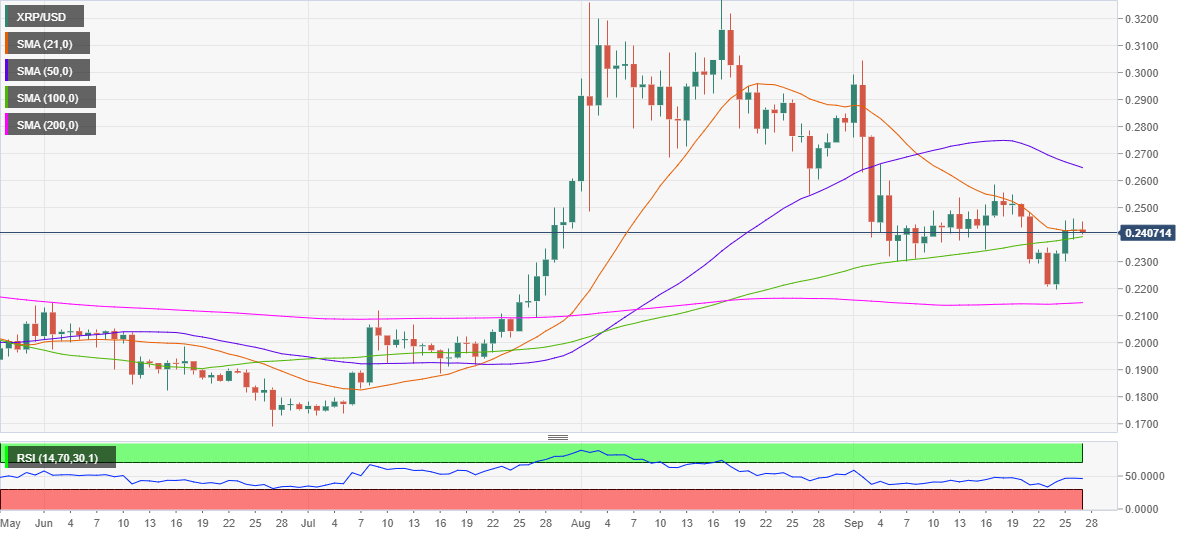
- Daily RSI has edged lower while within the bearish region.
- 100-DMA to test bears’ commitment after Saturday’s Doji candlestick.

Having faltered once again above 0.2450 this Sunday, Ripple (XRP/USD) snaps a three-day recovery momentum, as the coin battles 0.2400 amid the downbeat mood across the crypto board.
The XRP sellers returned after the price formed a Doji candlestick on the daily chart on Saturday, suggesting that the recovery from two-month lows of 0.2197 seems to have lost traction.
Backing the case for additional losses, the spot has failed to secure a sustained break above the horizontal 21-day Simple Moving Average (DMA), now at 0.2416 while the 14-day Relative Strength Index (RSI) points south within the bearish territory.
Therefore, the bears need a daily closing below the 100-DMA support at 0.2392 to negate the bullish reversal.
The next downside target sits at the two-month lows just below the 0.2200 level. Further south, the horizontal 200-DMA at 0.2148 will be the last straw for the XRP bulls.
To the upside, the buyers could target the September 19 high at 0.2585 before taking on the downward-sloping 50-DMA barrier at 0.2648.
XRP/USD: Daily chart
XRP/USD: Additional levels to consider
Author

Dhwani Mehta
FXStreet
Residing in Mumbai (India), Dhwani is a Senior Analyst and Manager of the Asian session at FXStreet. She has over 10 years of experience in analyzing and covering the global financial markets, with specialization in Forex and commodities markets.


