Ripple Price Prediction: XRP shows convincing setup for a rally towards $0.5
- XRP price seems to have formed an ascending triangle on the weekly chart.
- If Ripple's native token manages to flip $0.31 as support, it could target $0.5.

After closing the previous five days in positive territory and testing its highest level since mid-August at $0.3085, XRP staged a technical correction on November 18. The bearish momentum saw it lose more than 6% in value, dropping to a low of $0.2832.
$0.31 aligns as a key hurdle for XRP
XRP seems to have formed an ascending triangle on the weekly chart, with the trend line coming from early March when the price hit a low of $0.10. On the upside, the rebound met stiff resistance in late-July and early-August around $0.31, which caused Ripple to retreat.
Ascending triangles are usually considered as continuation patterns and a decisive break beyond $0.31 could bring in more buyers and provide a boost to XRP. Using the widest part of the triangle, the target on the upside could be set at $0.5, which coincides with a 60% gain.
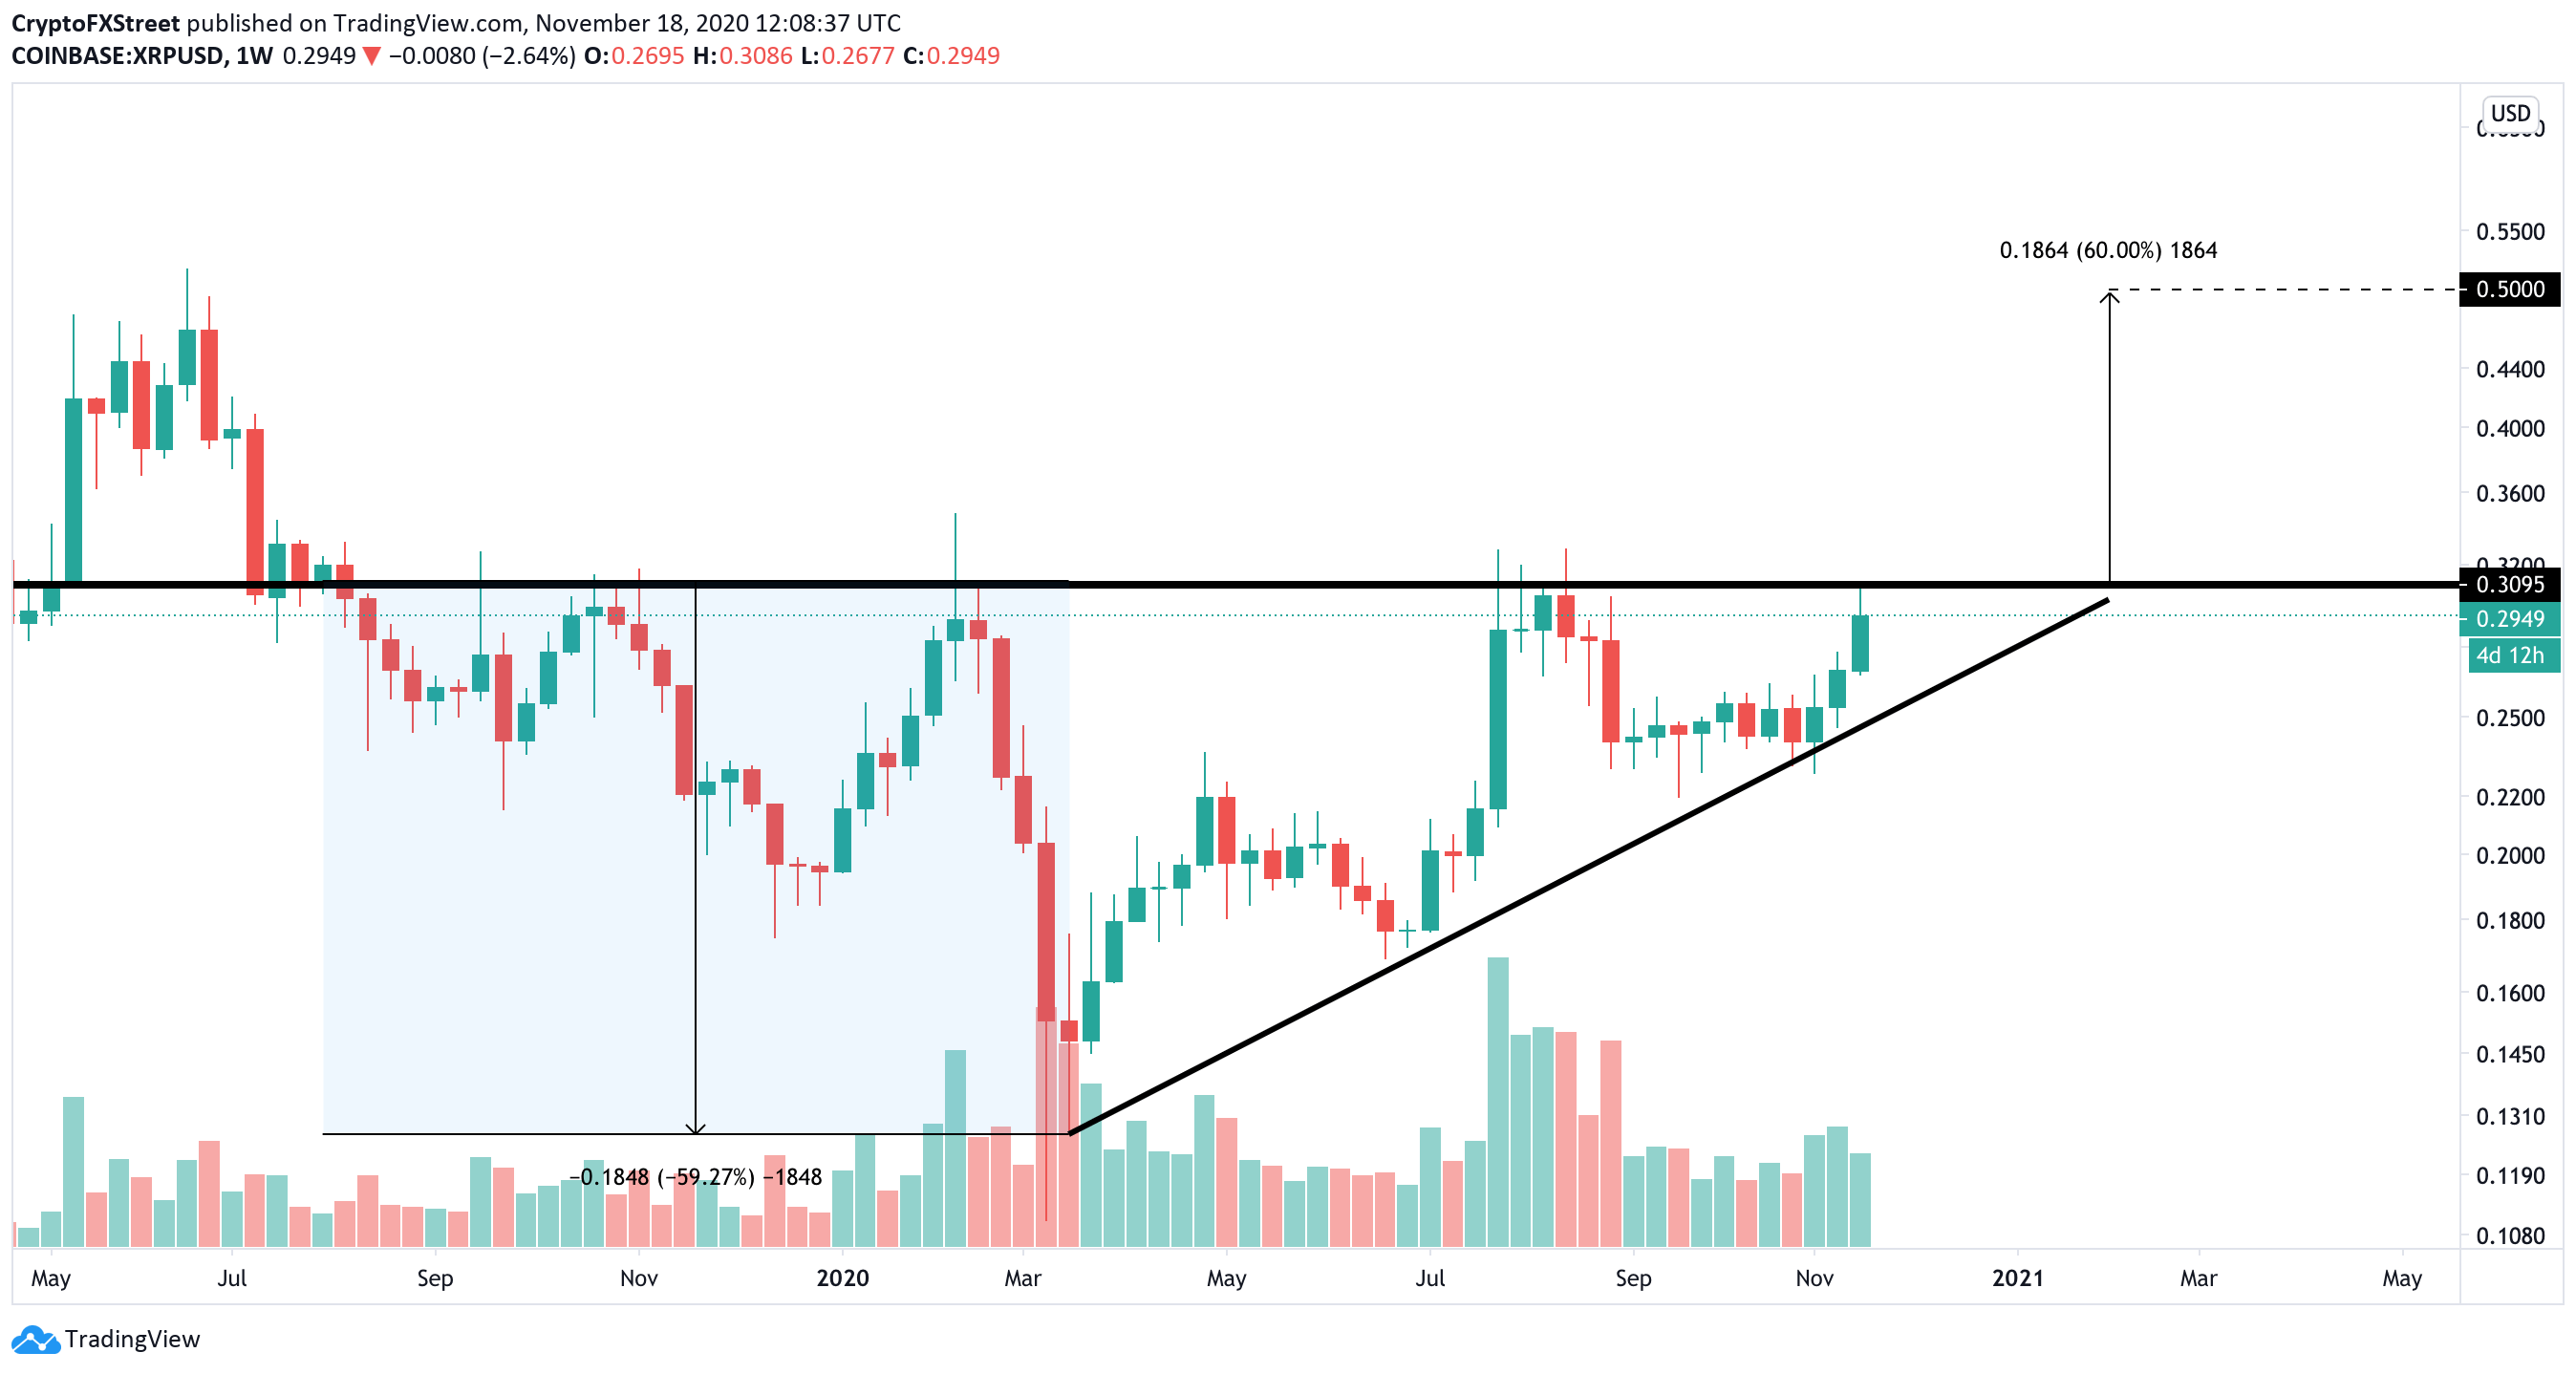
XRP/USD 1-week chart
Meanwhile, the recent spike seen in network activity reinforces the expectation for a breakout. The chart below shows that investors appear to be re-entering the market and believing in XRP's upside potential. In the past, a rising network growth has led to rising prices.
Now, a similar price action could be about to take place if this cryptocurrency manages to turn the $0.31 resistance barrier into support.
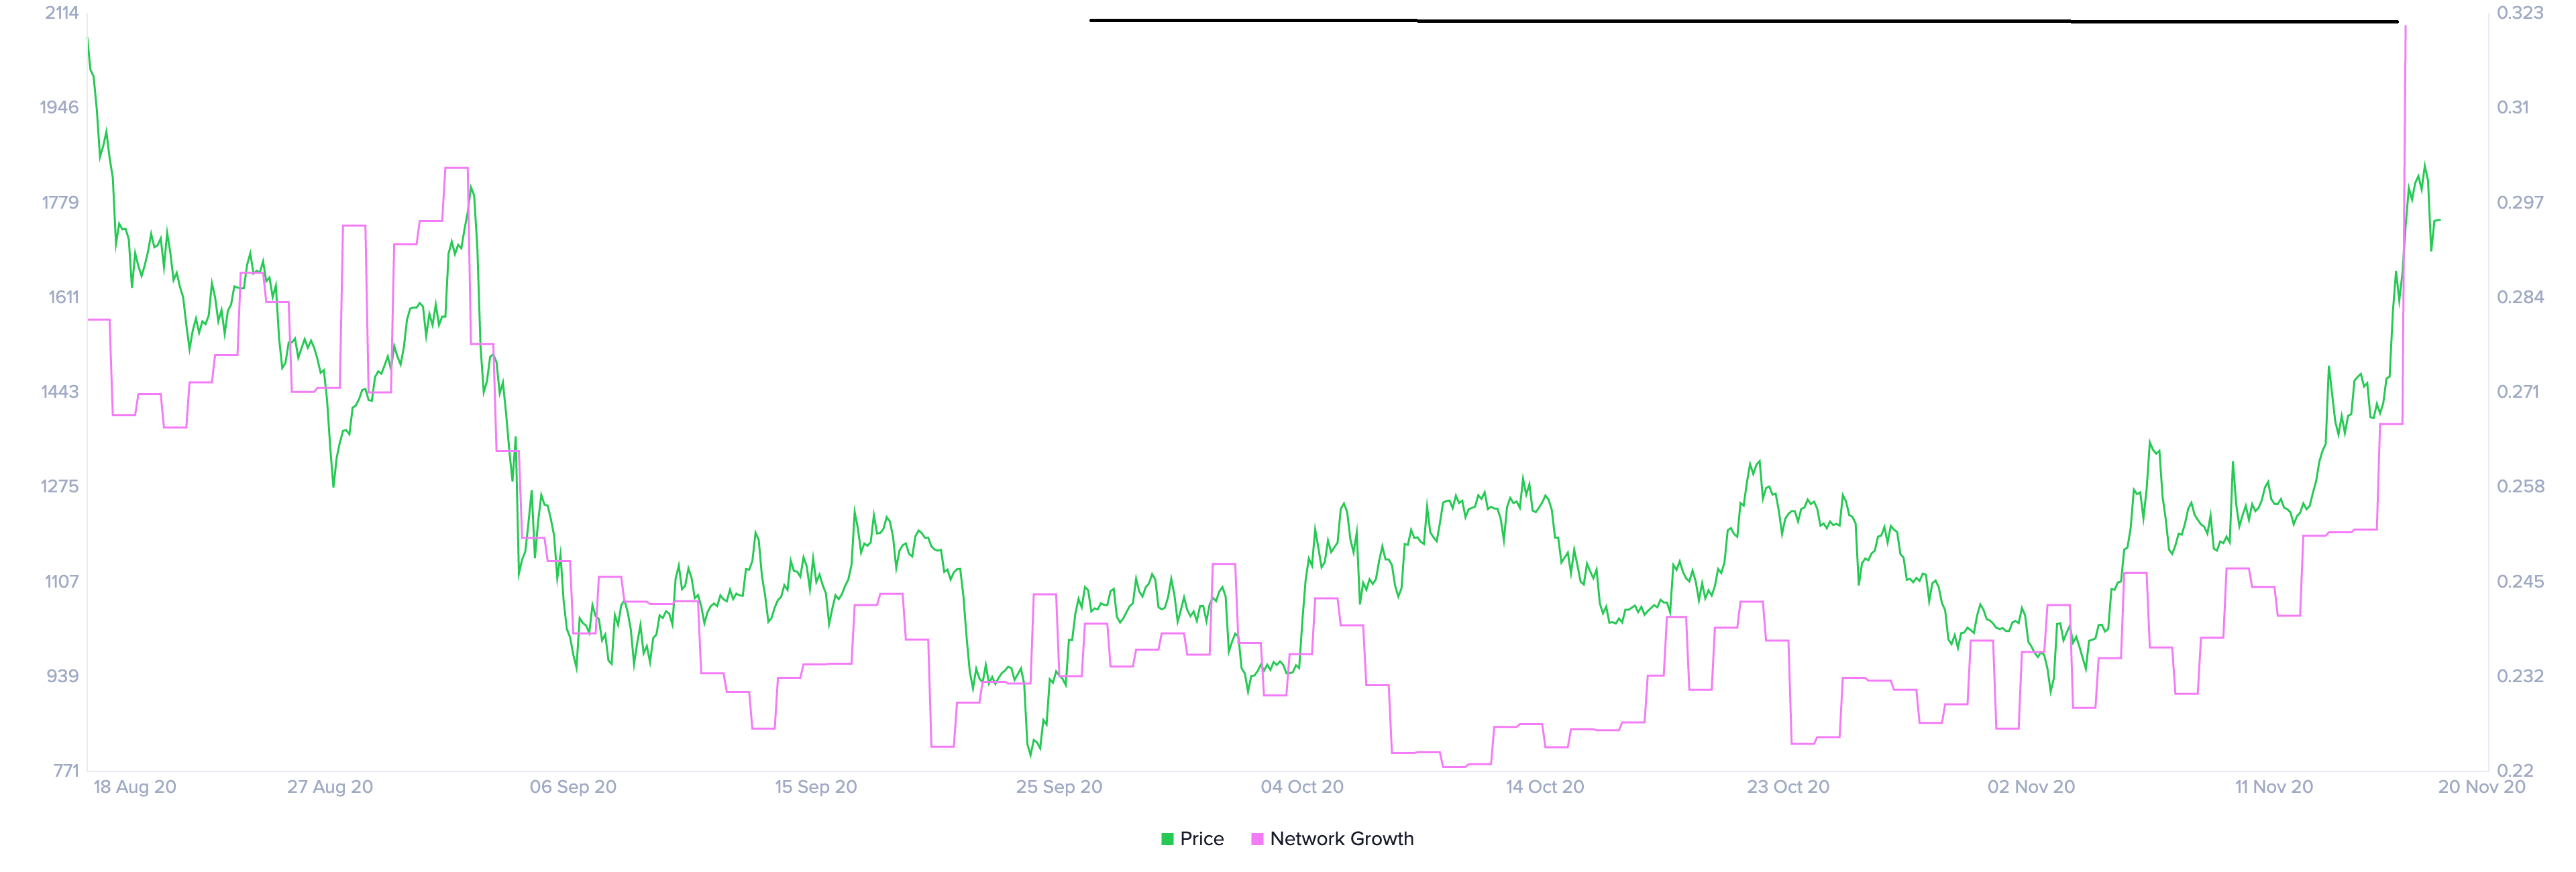
Ripple network growth chart
It is worth mentioning that the most recent rejection at $0.31 could force XRP price to extend its slide to $0.27, where the ascending trend line is located. If this support manages to hold, the ascending triangle will remain intact and the bullish outlook will also prevail. However, a weekly close below this support level could be seen as a discouraging development and attract more sellers.
Author

Eren Sengezer
FXStreet
As an economist at heart, Eren Sengezer specializes in the assessment of the short-term and long-term impacts of macroeconomic data, central bank policies and political developments on financial assets.


