XRP risks extending bearish run as risk-off sentiment, muted ETF flows cap momentum
- XRP extends its downward trajectory, slipping below $1.40 after encountering resistance at the $1.45 weekly high.
- Risk-averse sentiment deepens amid muted activity in the XRP spot ETFs.
- XRP exhibits a weak technical structure, with deteriorating momentum indicators.

Ripple (XRP) is edging lower below $1.40 at the time of writing on Tuesday, as the broader crypto market faces renewed volatility. The remittance token is under intense sell-side pressure and struggling to hold key support levels amid growing risk-off sentiment.
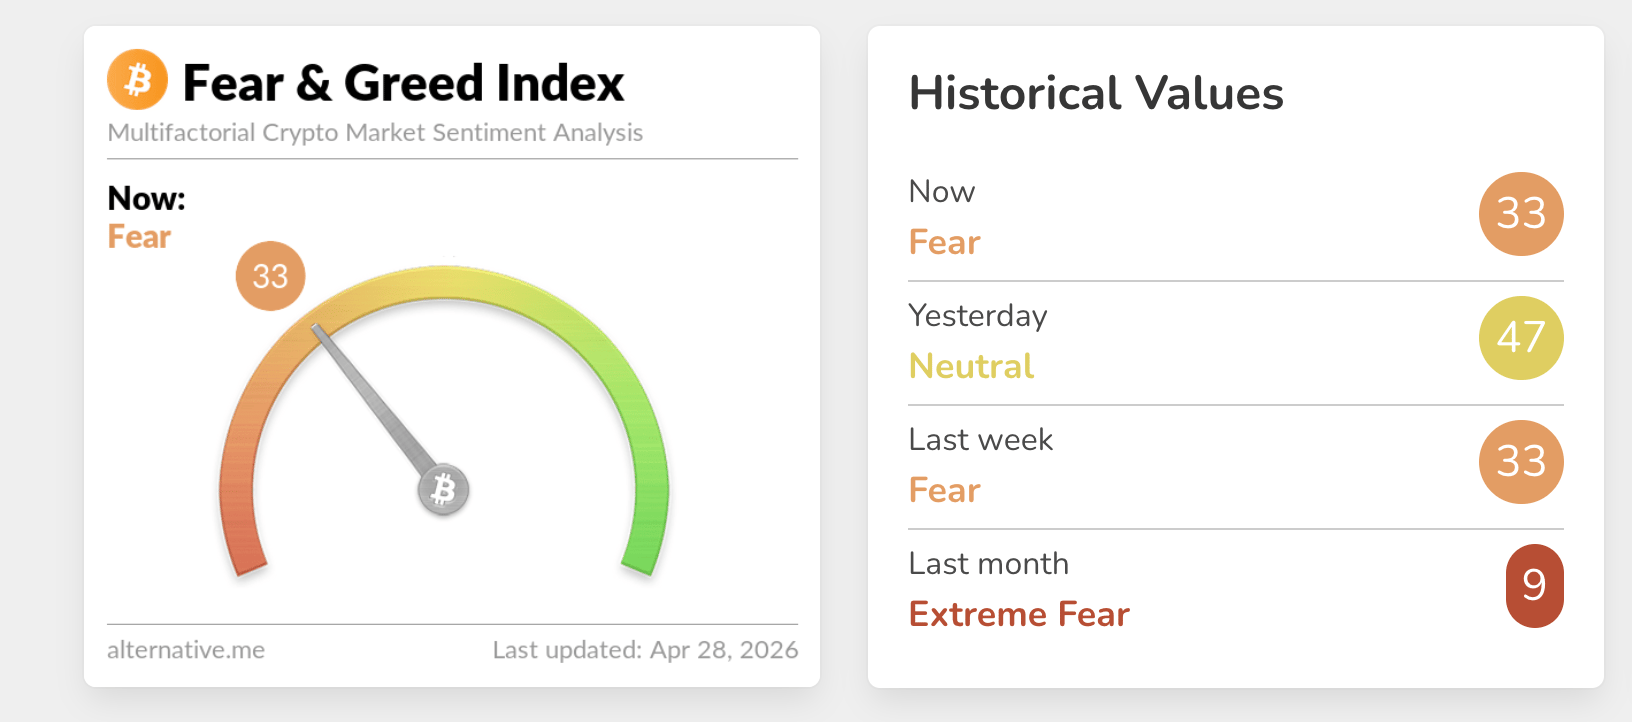
The conflict in the Middle East continues to drive investors on edge, while the crypto Fear & Greed Index declines to 33 on Tuesday, from 47 the previous day. Despite the United States (US)-Iran ceasefire holding, the Strait of Hormuz is still shut.
Reports say that US President Donald Trump is unlikely to accept Iran’s proposal to open the Strait, which skips Tehran’s nuclear program. Dismantling Iran’s nuclear program remains to be Trump’s hardline point to ending the war.
Risk-off sentiment persists amid muted ETF activity
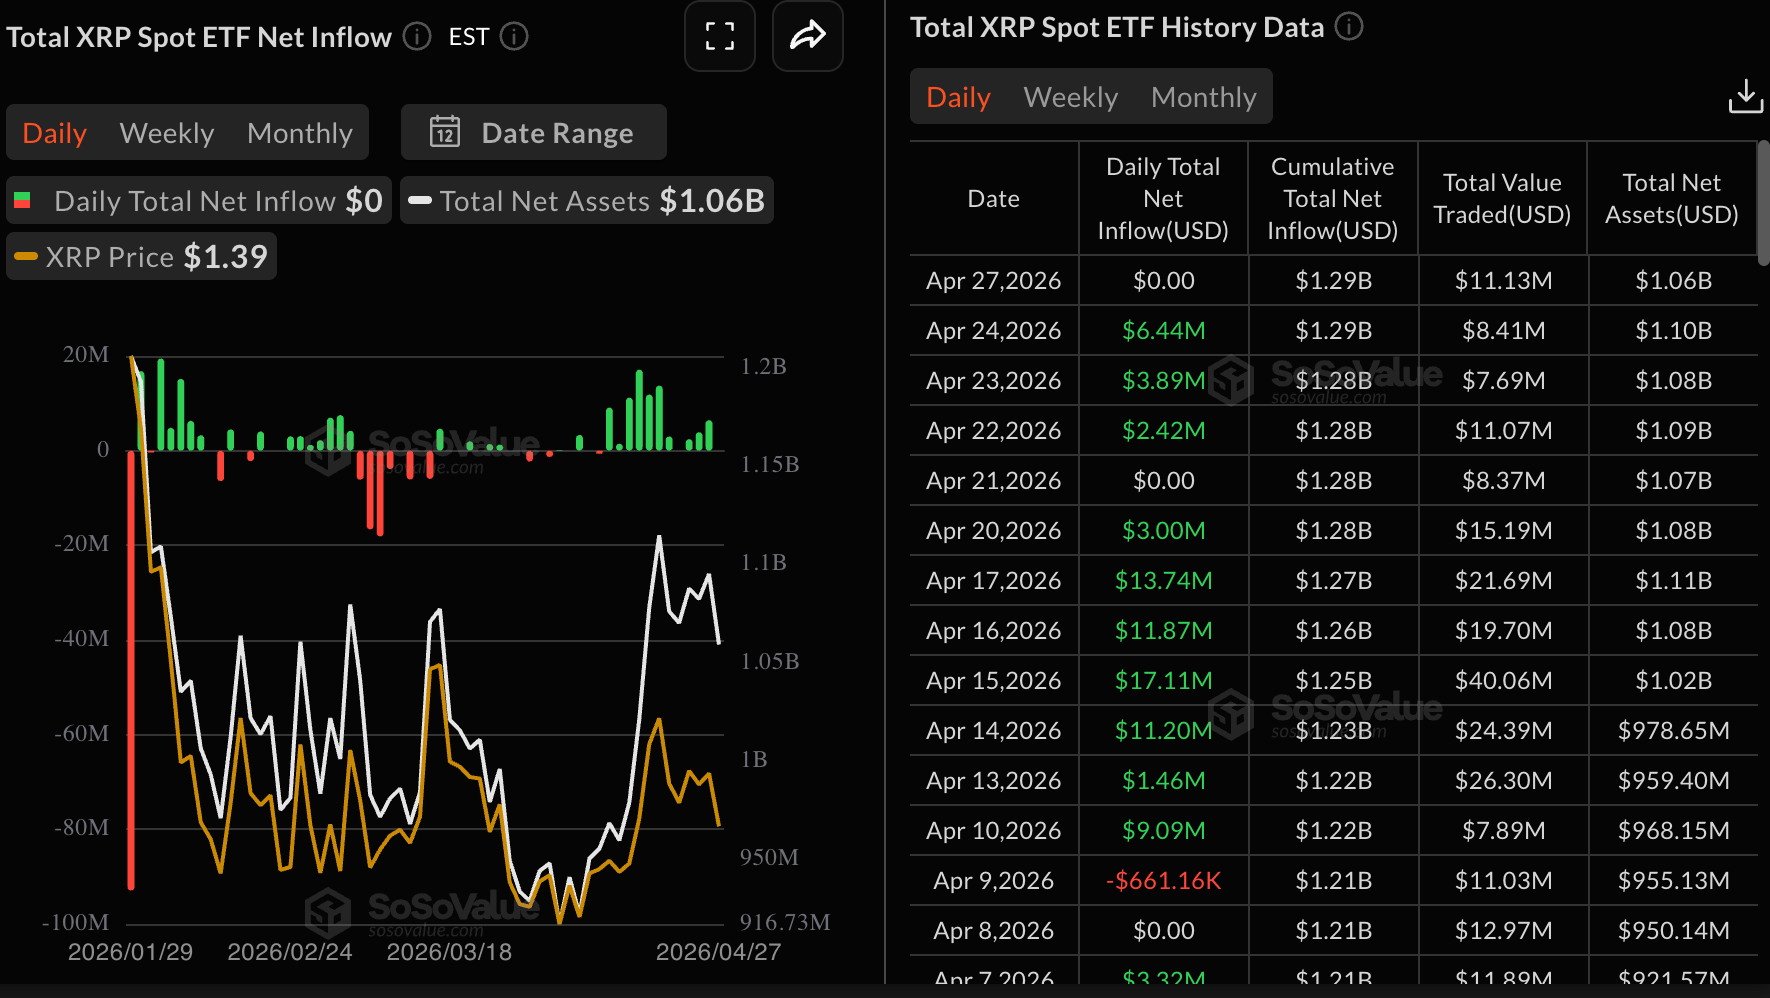
Institutional interest in XRP digital investment products shows signs of deterioration, as ETFs remained quiet on Monday, with no flows recorded, according to SoSoValue data. Cumulative inflows held at $1.29 billion, while net assets under management averaged $1.06 billion. If sentiment softens further amid deteriorating risk appetite, recovery for XRP could be an uphill battle.
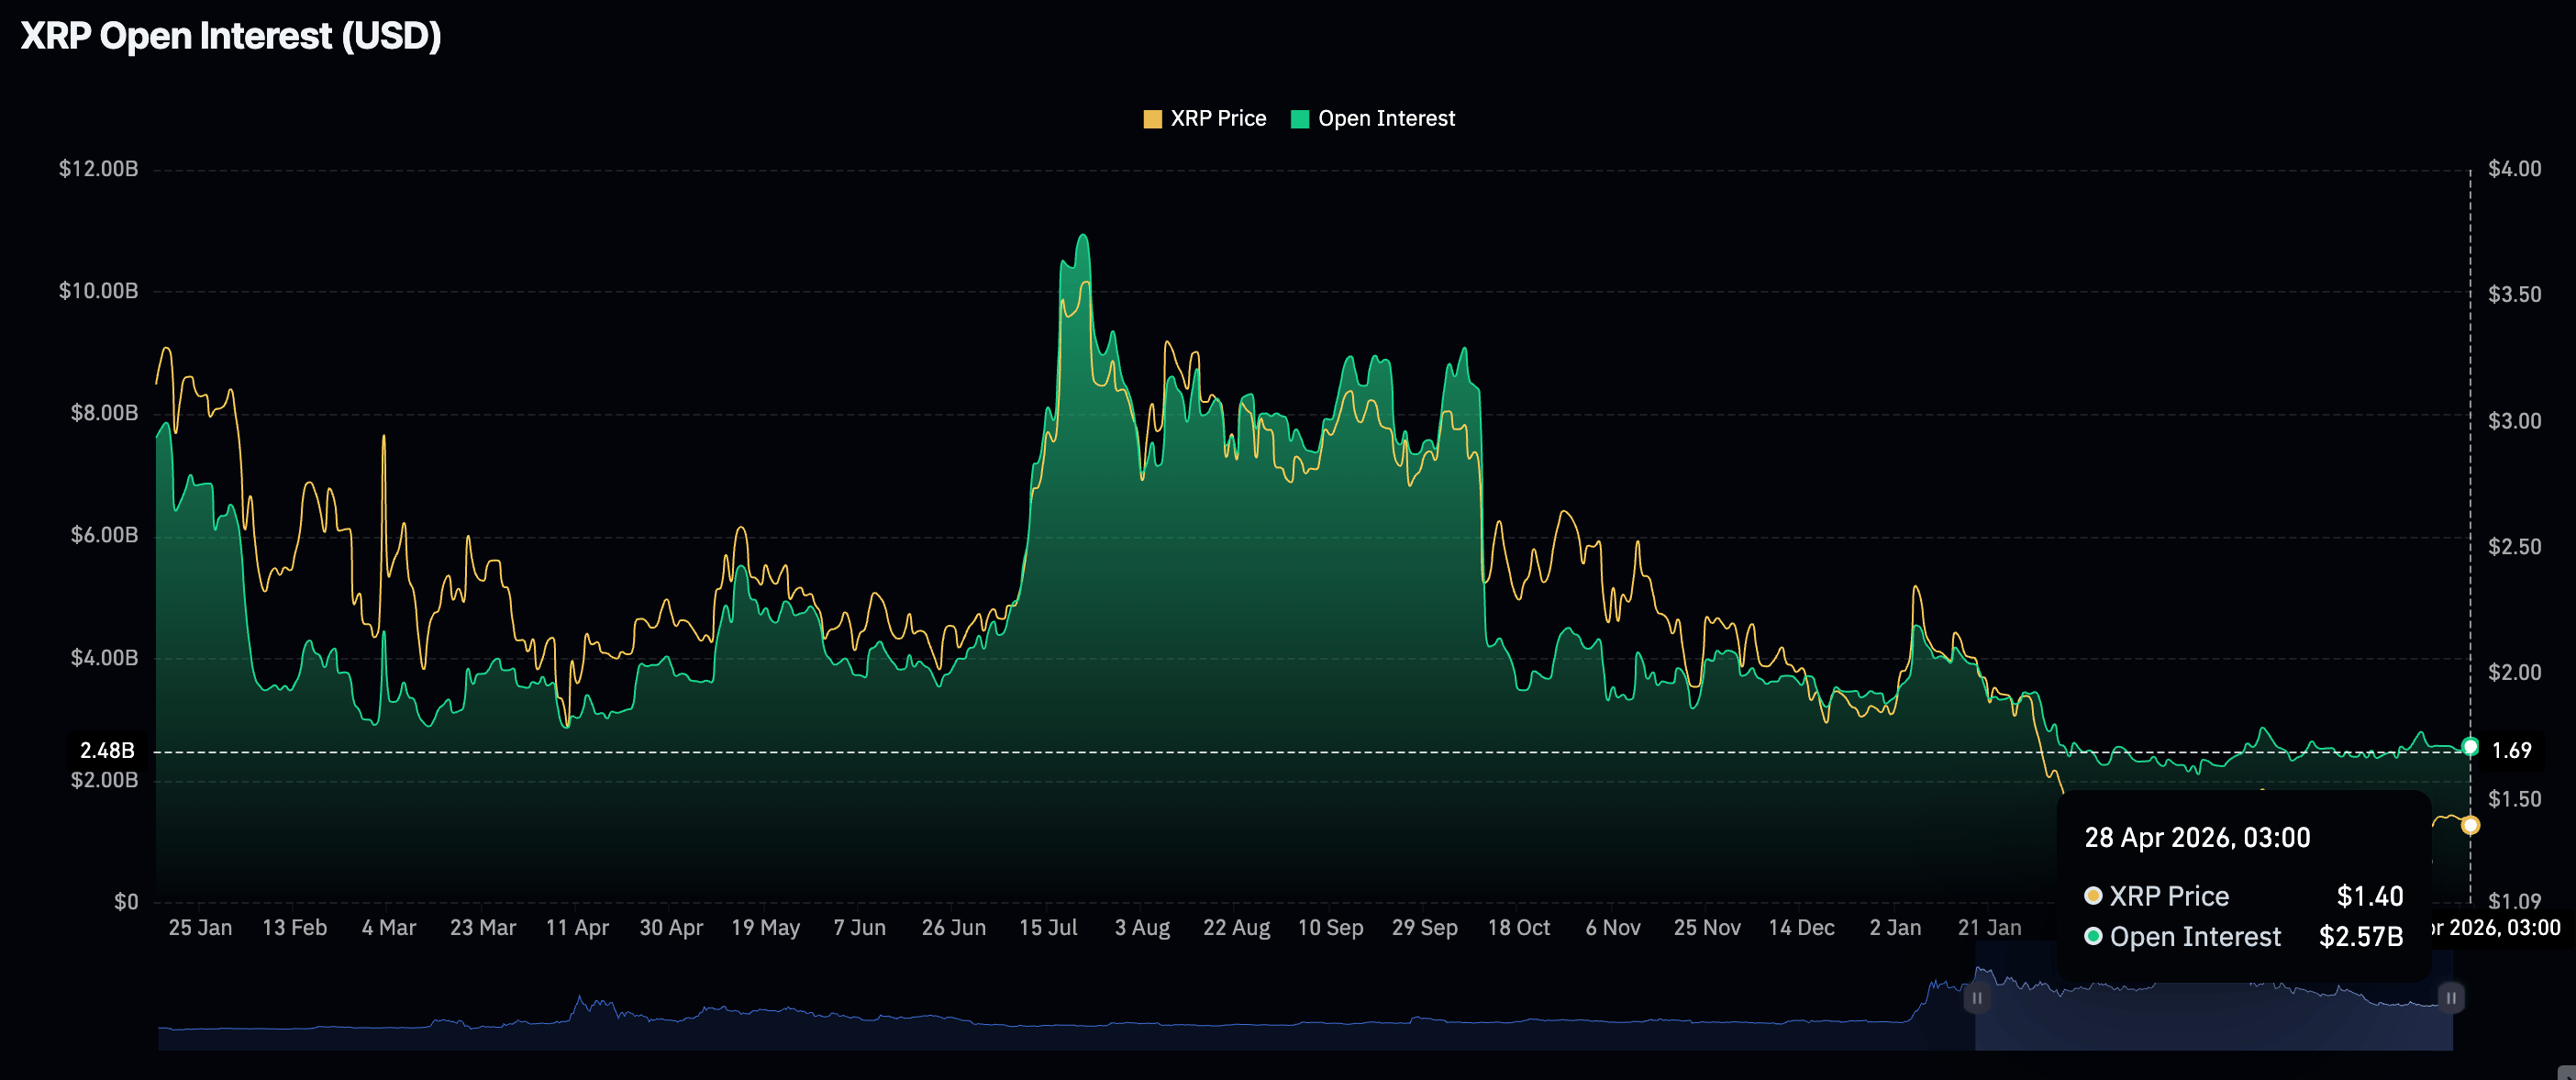
Despite retail demand holding steady with the futures Open Interest (OI) at $2.57 billion, it pales in comparison to the record $10.94 billion reached in July. Low retail demand signals that investors lack conviction in XRP’s ability to sustain the uptrend. Hence, there is an unwillingness to open new positions.
Technical outlook: XRP at risk of extending losses
XRP trades at $1.38, maintaining a bearish near-term bias. The price holds below the 20-day Simple Moving Average (SMA) of the Bollinger Bands around $1.40 and the 50-day Exponential Moving Average near $1.41, confirming a broader bearish outlook.
The Relative Strength Index (RSI) sits just below the 50 midline, around 47 on the daily chart, while the Moving Average Convergence Divergence (MACD) histogram has slipped marginally back below zero, with the signal line turning down. Both indicators suggest waning upside momentum as rallies meet overhead supply.
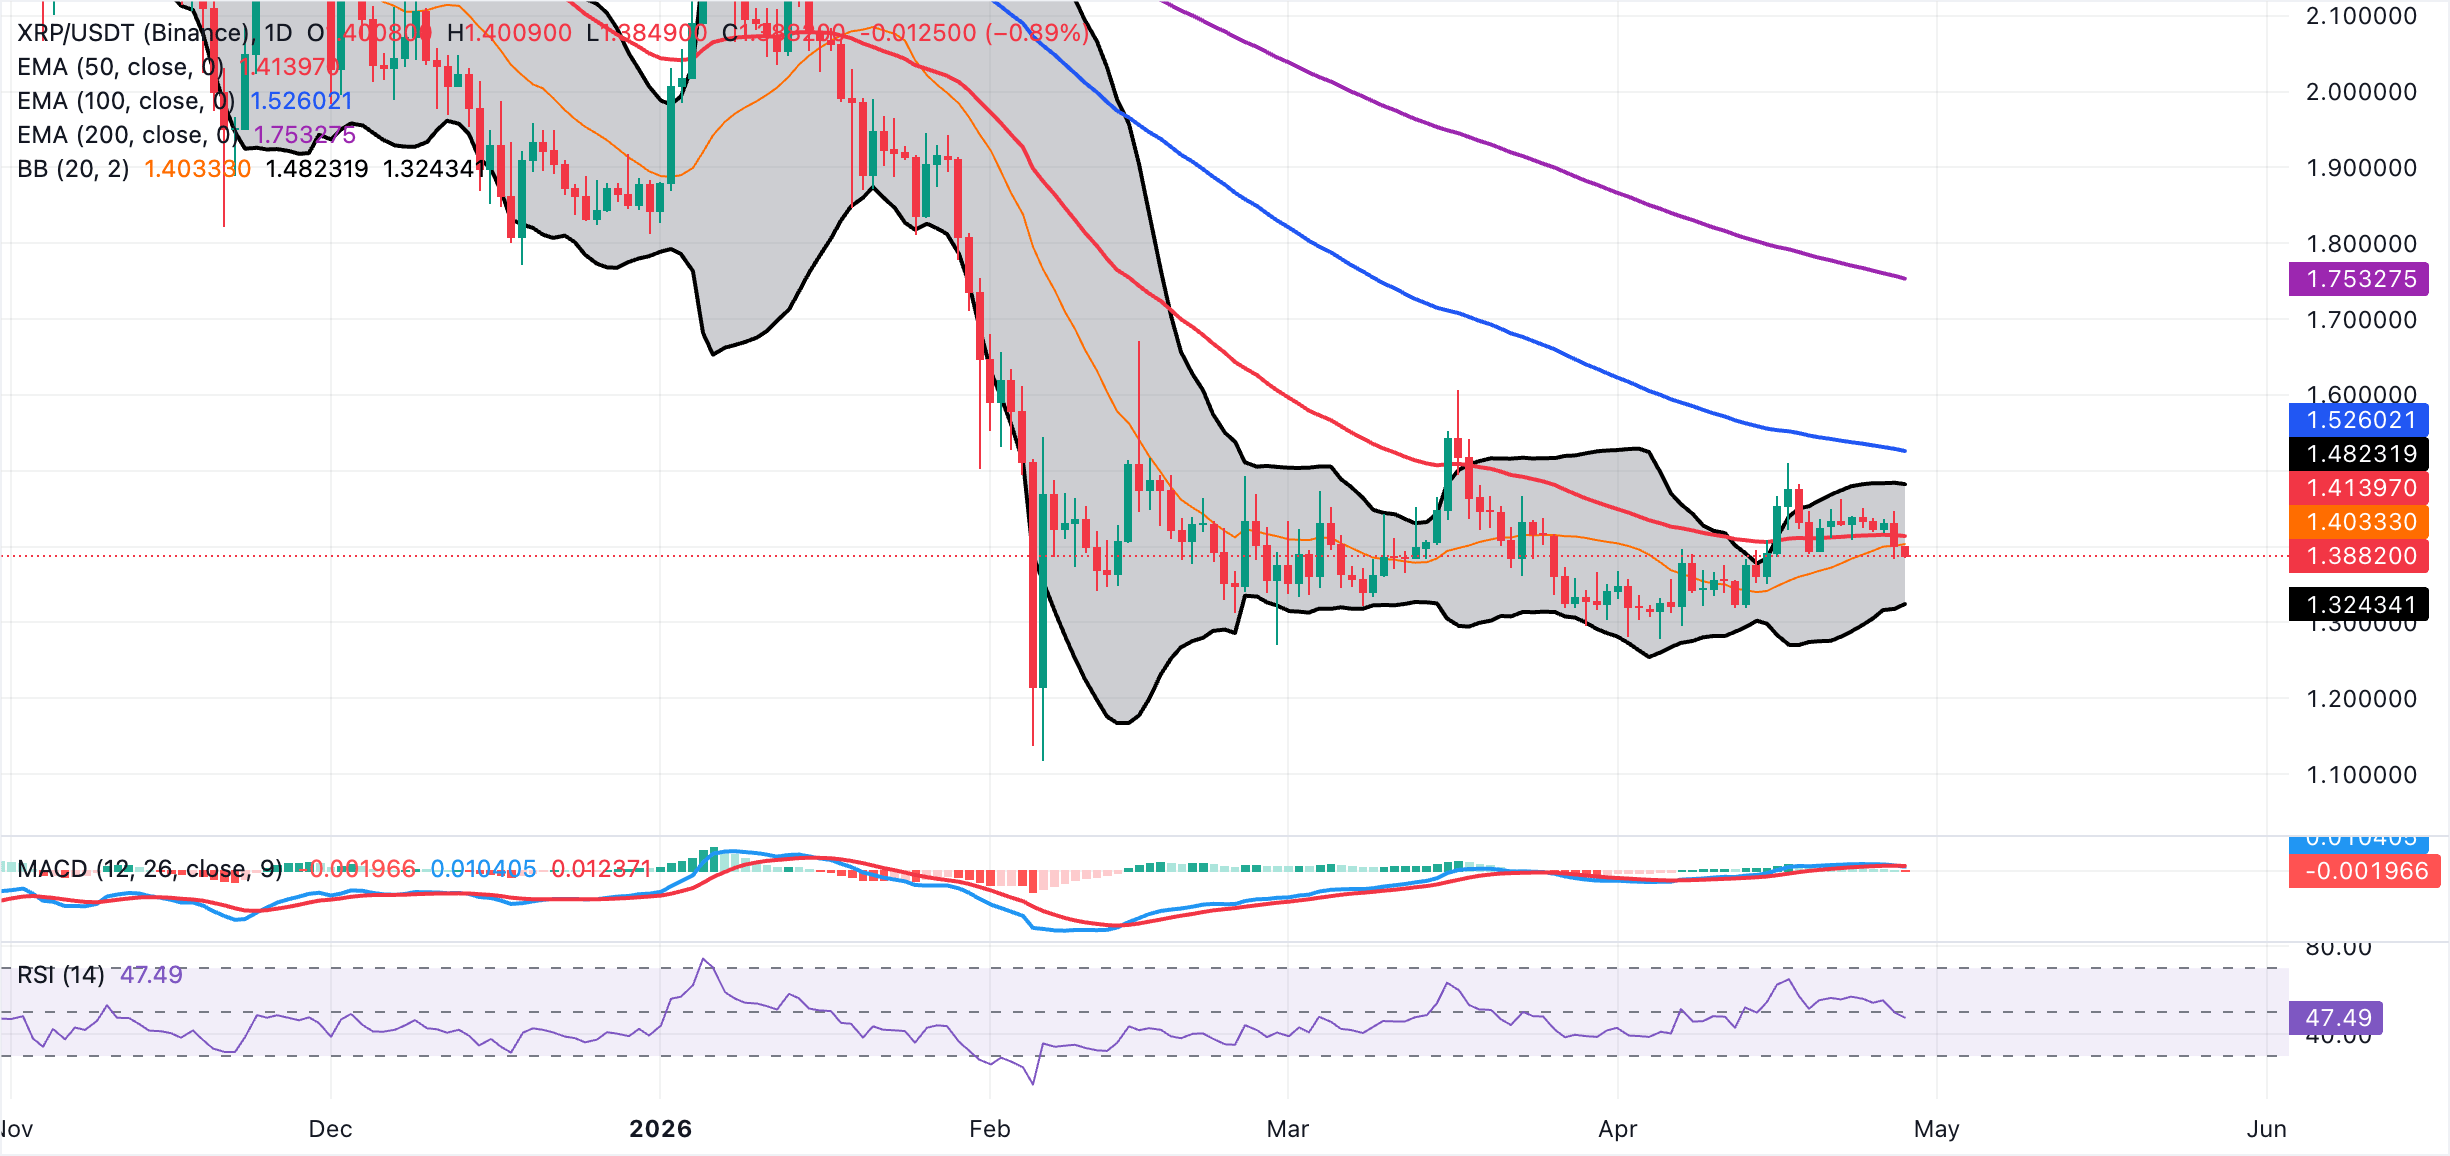
On the topside, initial resistance is aligned at the Bollinger Bands' middle boundary at $1.40, followed by the 50-day EMA around $1.41. A stronger recovery would face further caps at the upper Bollinger Band near $1.48, then at the 100-day EMA at $1.53, and the 200-day EMA near $1.75, reasserting the broader bearish structure. On the downside, the lower Bollinger Band at roughly $1.32 serves as the next notable support, with a sustained break below it likely opening the door to deeper losses within the prevailing daily downtrend.
(The technical analysis of this story was written with the help of an AI tool.)
Ripple FAQs
Ripple is a payments company that specializes in cross-border remittance. The company does this by leveraging blockchain technology. RippleNet is a network used for payments transfer created by Ripple Labs Inc. and is open to financial institutions worldwide. The company also leverages the XRP token.
XRP is the native token of the decentralized blockchain XRPLedger. The token is used by Ripple Labs to facilitate transactions on the XRPLedger, helping financial institutions transfer value in a borderless manner. XRP therefore facilitates trustless and instant payments on the XRPLedger chain, helping financial firms save on the cost of transacting worldwide.
XRPLedger is based on a distributed ledger technology and the blockchain using XRP to power transactions. The ledger is different from other blockchains as it has a built-in inflammatory protocol that helps fight spam and distributed denial-of-service (DDOS) attacks. The XRPL is maintained by a peer-to-peer network known as the global XRP Ledger community.
XRP uses the interledger standard. This is a blockchain protocol that aids payments across different networks. For instance, XRP’s blockchain can connect the ledgers of two or more banks. This effectively removes intermediaries and the need for centralization in the system. XRP acts as the native token of the XRPLedger blockchain engineered by Jed McCaleb, Arthur Britto and David Schwartz.
Author

John Isige
FXStreet
John Isige is a seasoned cryptocurrency journalist and markets analyst committed to delivering high-quality, actionable insights tailored to traders, investors, and crypto enthusiasts. He enjoys deep dives into emerging Web3 tren


