Pi Network Price Forecast: PI risks bearish reversal from key resistance trendline
- Pi Network edges lower on Friday, capped below an overhead descending trendline near $0.0910.
- Speculative demand holds firm with PI futures Open Interest above $9 million on Friday.
- The technical outlook for PI indicates a near-term bearish bias, with risks of further decline.

Pi Network (PI) edges lower on Friday, extending the losses from the previous day. Retail demand holds firm in the near term, as PI futures Open Interest has remained above $9 million over the last three days. The technical outlook for PI highlights a downside risk as the price remains capped by an overhead trendline near $0.0910.
Pi Network holds retail demand amid market volatility
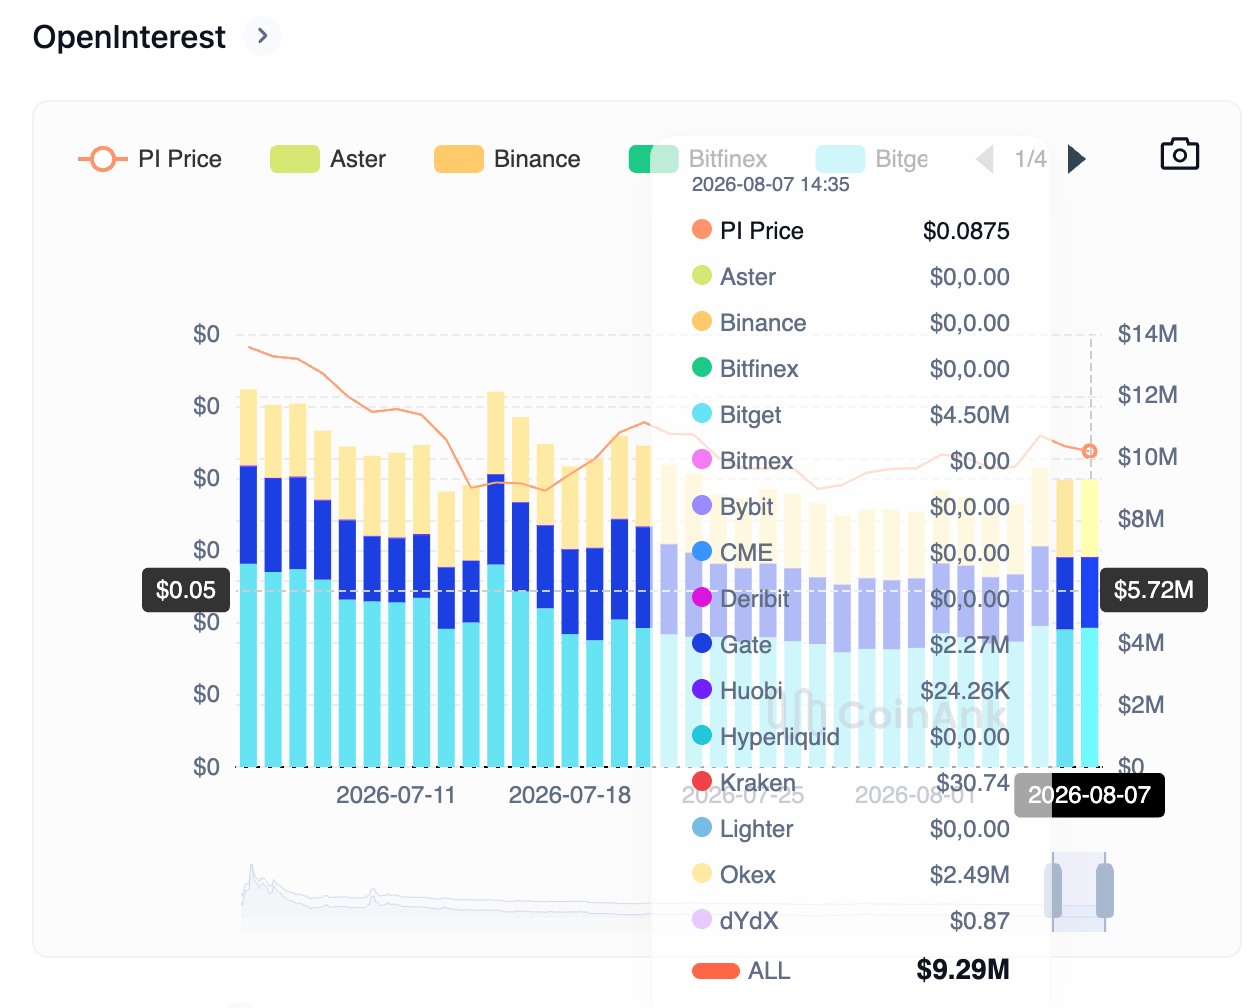
Pi Network shows steady retail support amid growing market volatility linked to the delay in the CLARITY Act vote and the lingering US-Iran tensions. CoinAnk data shows the PI futures Open Interest (OI) is at $9.21 million, holding steady above the $9 million for the third consecutive day. However, the OI fell to $9.69 million on Wednesday, indicating a mild easing in the notional value of active perpetual contracts.
Technical outlook: Will PI hold its gains?
Pi Network trades at $0.0871 on Friday, sustaining its gains from the late-July lows. Still, PI remains capped below an overhead resistance trendline near $0.0910, which keeps the near-term bias bearish.
Momentum remains constructive on the daily chart, with the Relative Strength Index (RSI) at 46, rising toward the midline as selling pressure eases. Meanwhile, the Moving Average Convergence Divergence (MACD) is trending upward above its signal line in negative territory, reaffirming easing selling pressure.
PI must secure a decisive close above $0.0910 and the 127.2% Fibonacci extension level, measured from $0.1998 to $0.1183, at $0.0961, to reinstate a bullish trend. In such a case, the Fibonacci anchor at $0.1183 could serve as the next crucial barrier.
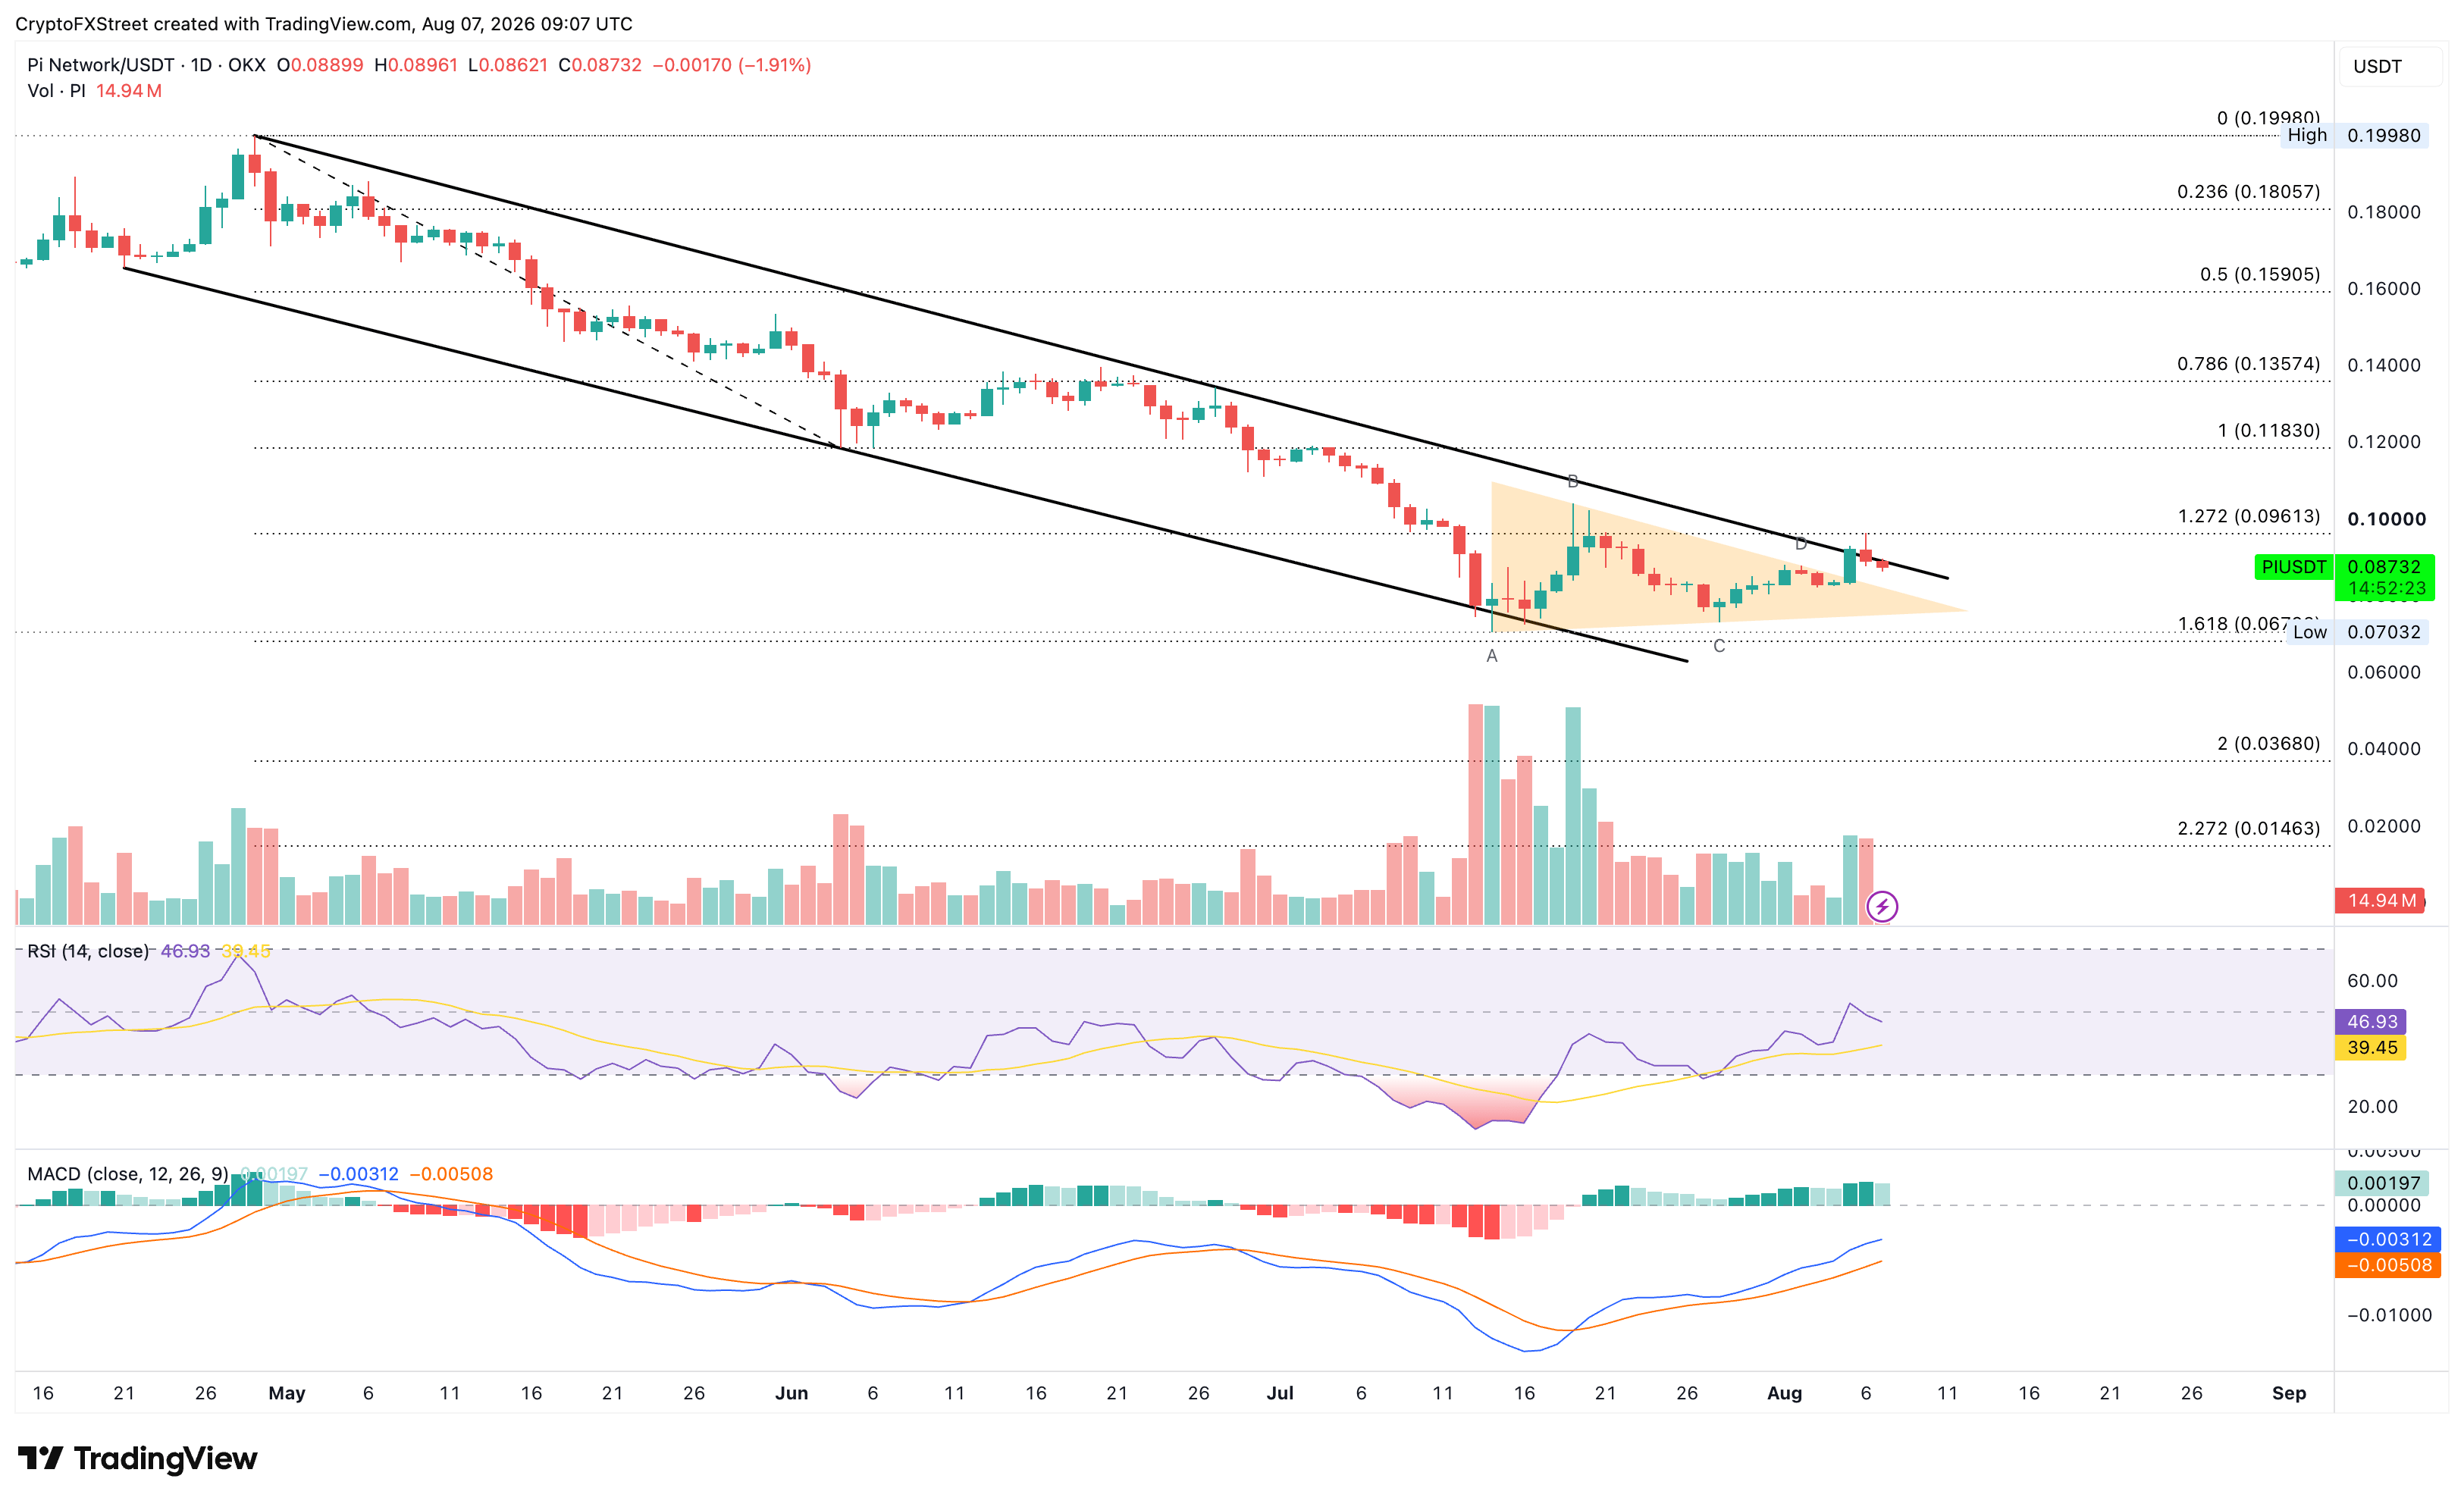
Looking down, the key support remains near its record low around $0.0700.
(The technical analysis of this story was written with the help of an AI tool. Know more.)
Author

Vishal Dixit
FXStreet
Vishal Dixit holds a B.Sc. in Chemistry from Wilson College but found his true calling in the world of crypto.




