Crypto Today: Bitcoin, Ethereum, XRP fall back amid deteriorating sentiment, ETF outflows
- Bitcoin extends its decline for the second consecutive day, reflecting a broader softening risk appetite and with ETF recording outflows.
- Ethereum drops below the $2,300 threshold amid risk-off sentiment, as $50 million in ETF withdrawals weigh on the market.
- XRP downside risks accelerate within a wider consolidation range, as momentum indicators turn bearish.

Cryptocurrency prices are broadly correcting on Tuesday, with Bitcoin (BTC) trading below $77,000, down from a weekly high of $79,486. Altcoins, including Ethereum (ETH) and Ripple (XRP), align with Bitcoin’s corrective structure.
After hitting a weekly high around $2,400, ETH hovers below the pivotal $2,300 level. Meanwhile, XRP bulls have lost grip on the $1.40 support, increasing the odds of an extended decline.
ETF outflows hit Bitcoin, Ethereum as risk-off mood returns
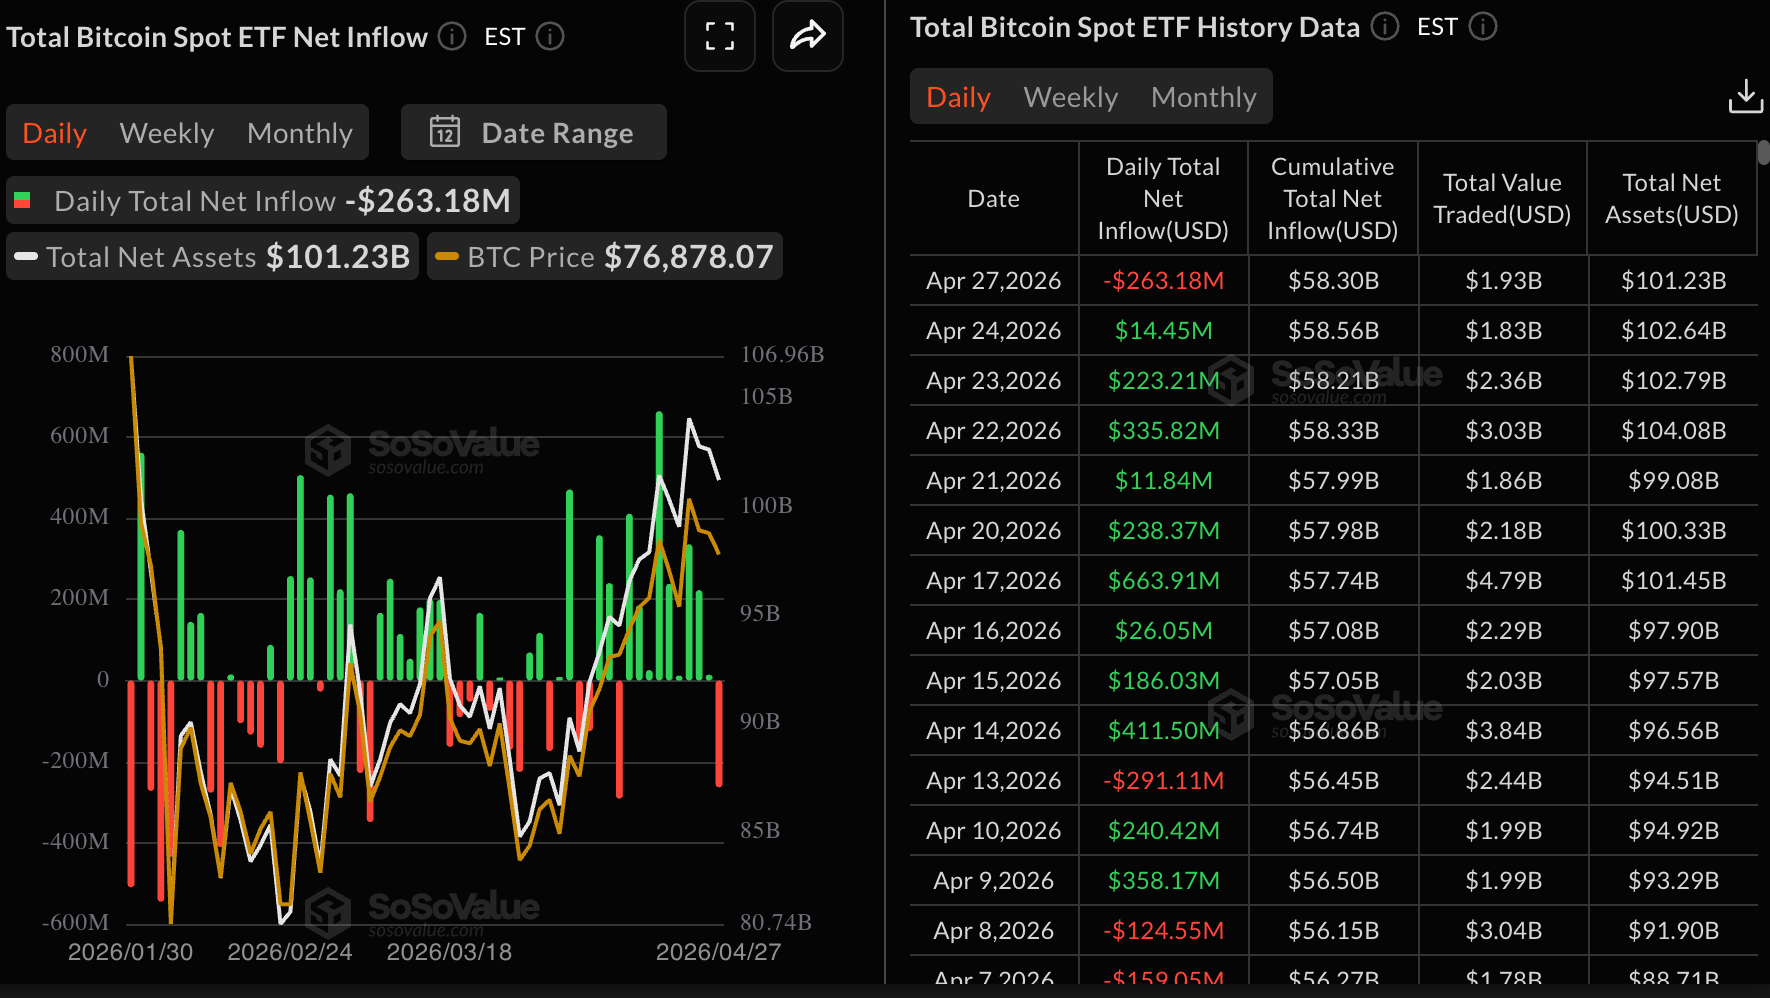
Bitcoin spot Exchange-Traded Funds (ETFs) kicked off the week on the back foot, recording roughly $263 million in outflows on Monday while breaking a steady nine-day bullish streak.
Cumulative inflows now stand at approximately $58 billion with net assets under management averaging $101 billion, according to SoSoValue data. If outflows persist this week, weak sentiment could weigh on Bitcoin and increase the chances of a prolonged sell-off.
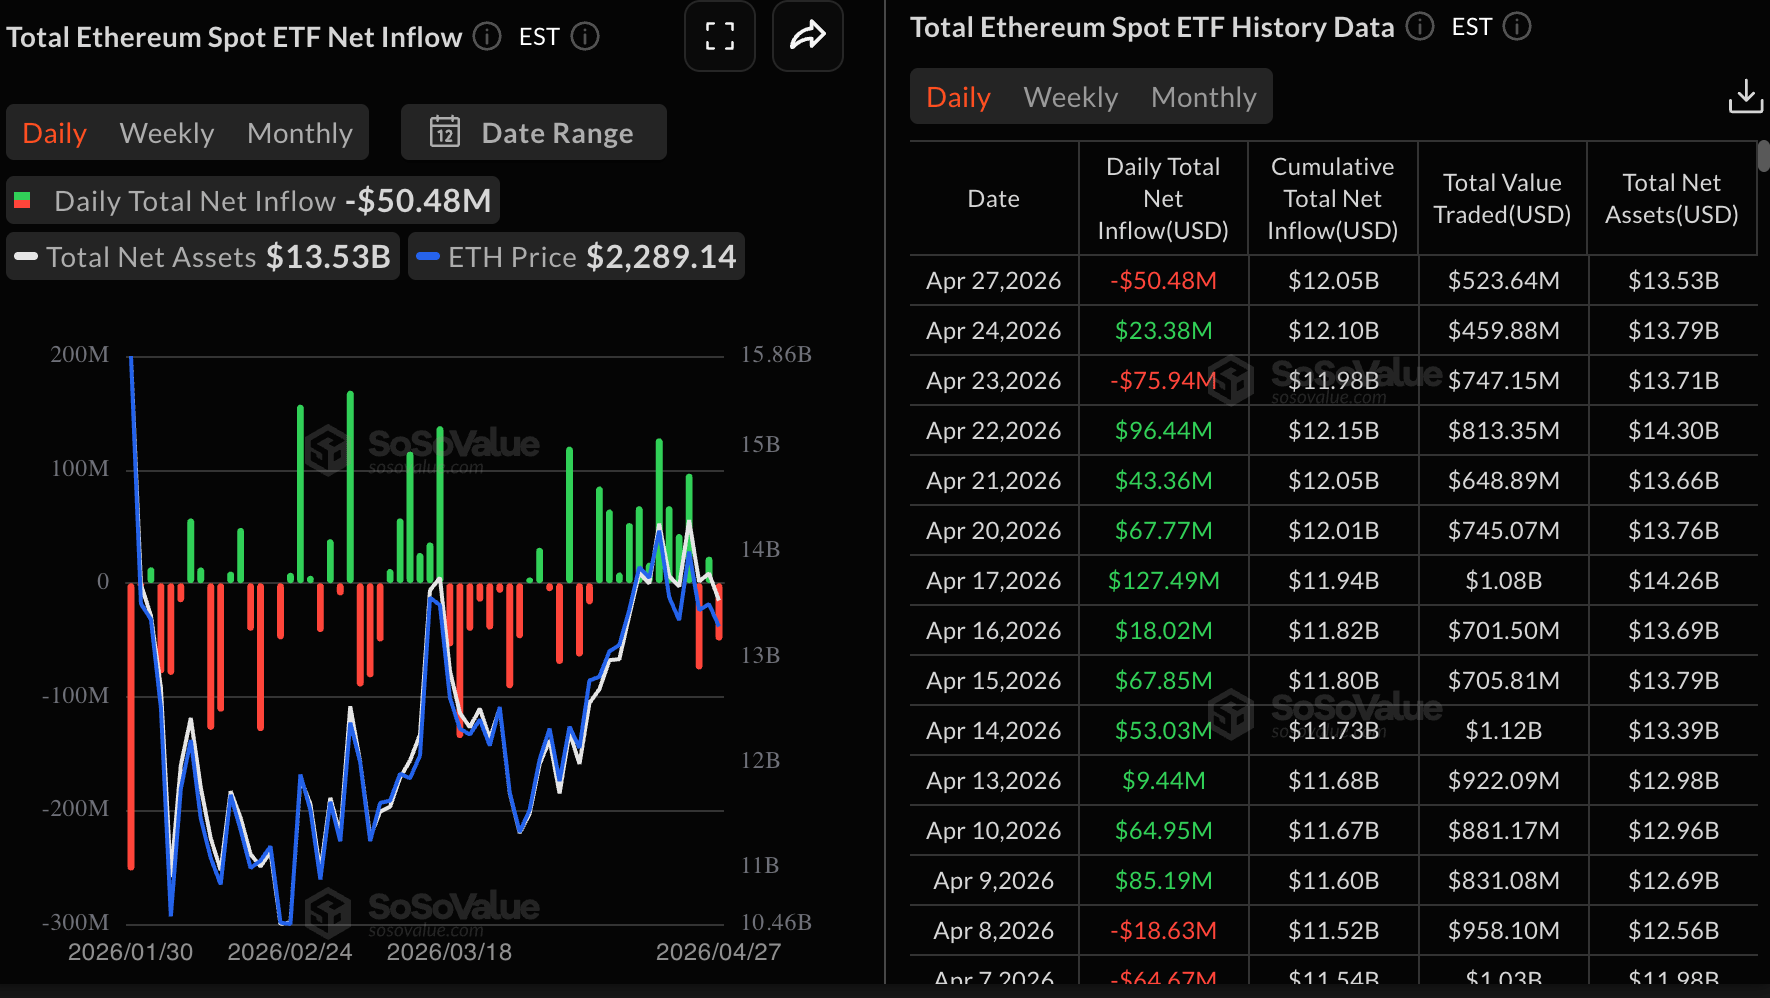
Ethereum spot ETFs also faced outflows on Monday, totaling $50 million, bringing cumulative inflows to $12.05 billion and net assets under management to nearly $14 billion.
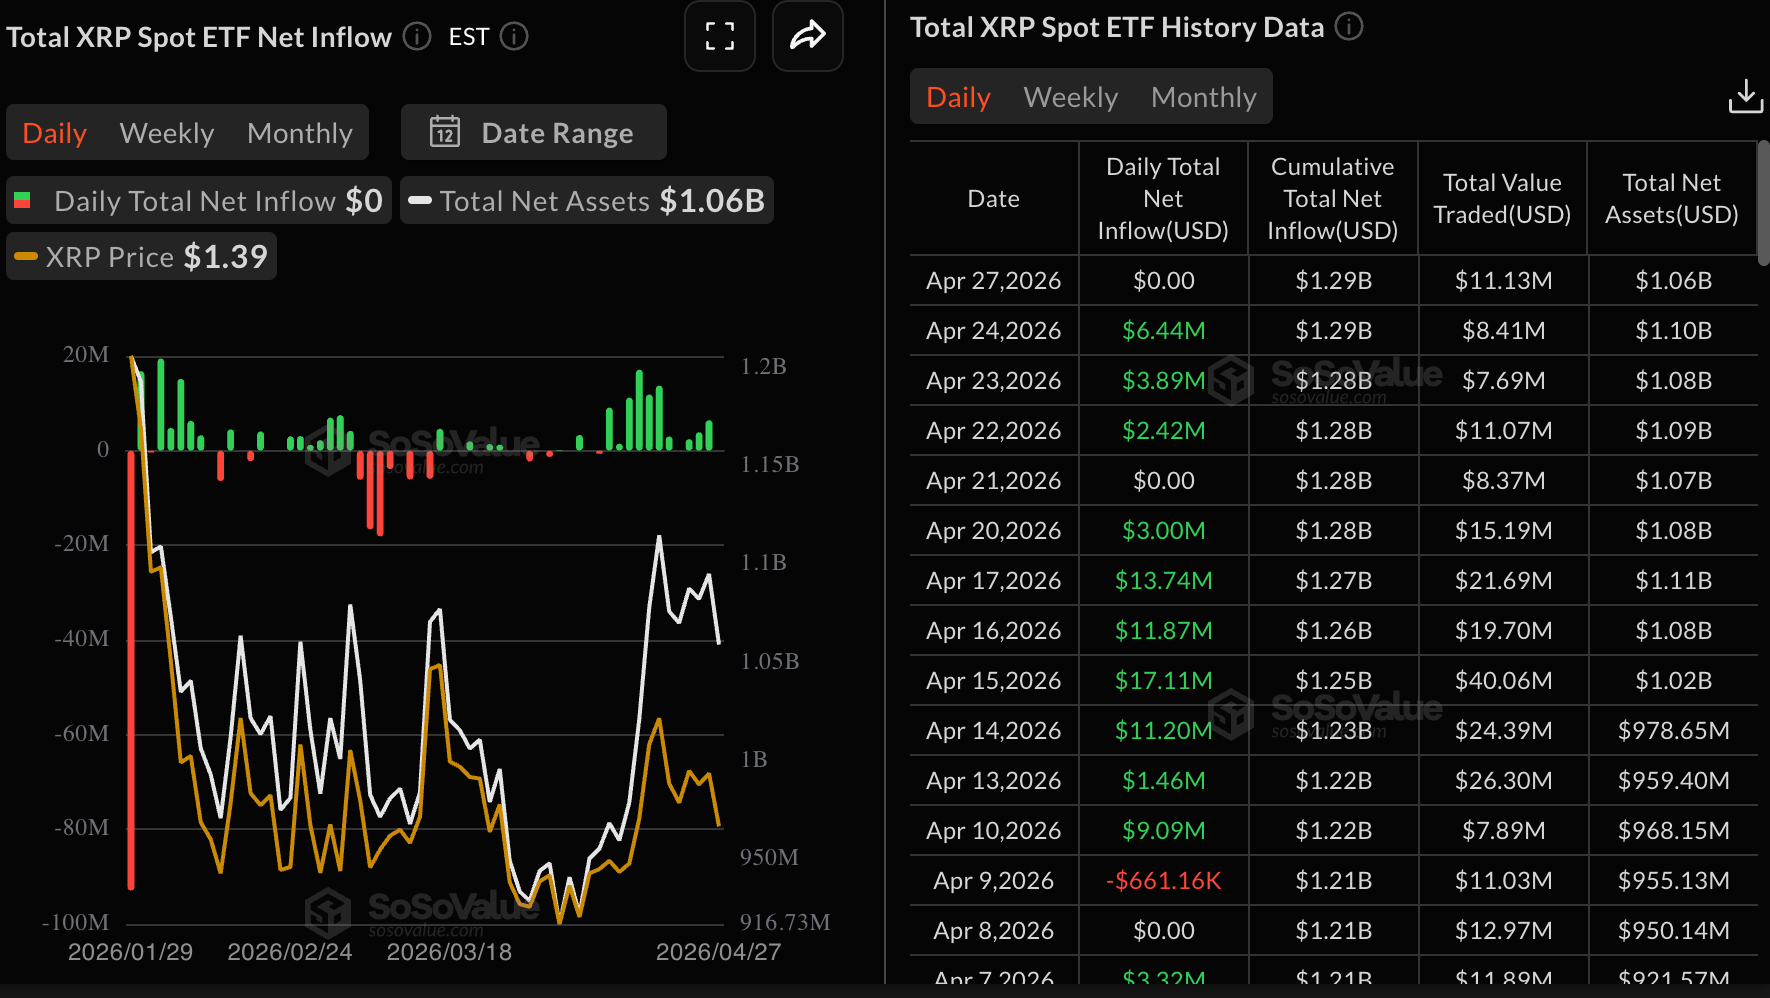
Meanwhile, US-listed XRP spot ETFs remained mute on Monday, recording no flows across all five investment products. Cumulative inflows now stand at approximately $1.29 billion, with net assets under management averaging $1.06 billion.
Broader crypto sentiment appears to be tracking developments in the US-Iran war. Despite the ceasefire holding, the path to a diplomatic resolution remains fragile amid reports saying that US President Donald Trump is unlikely to consider Tehran's new proposal to the White House because it does not address Iran's nuclear program.
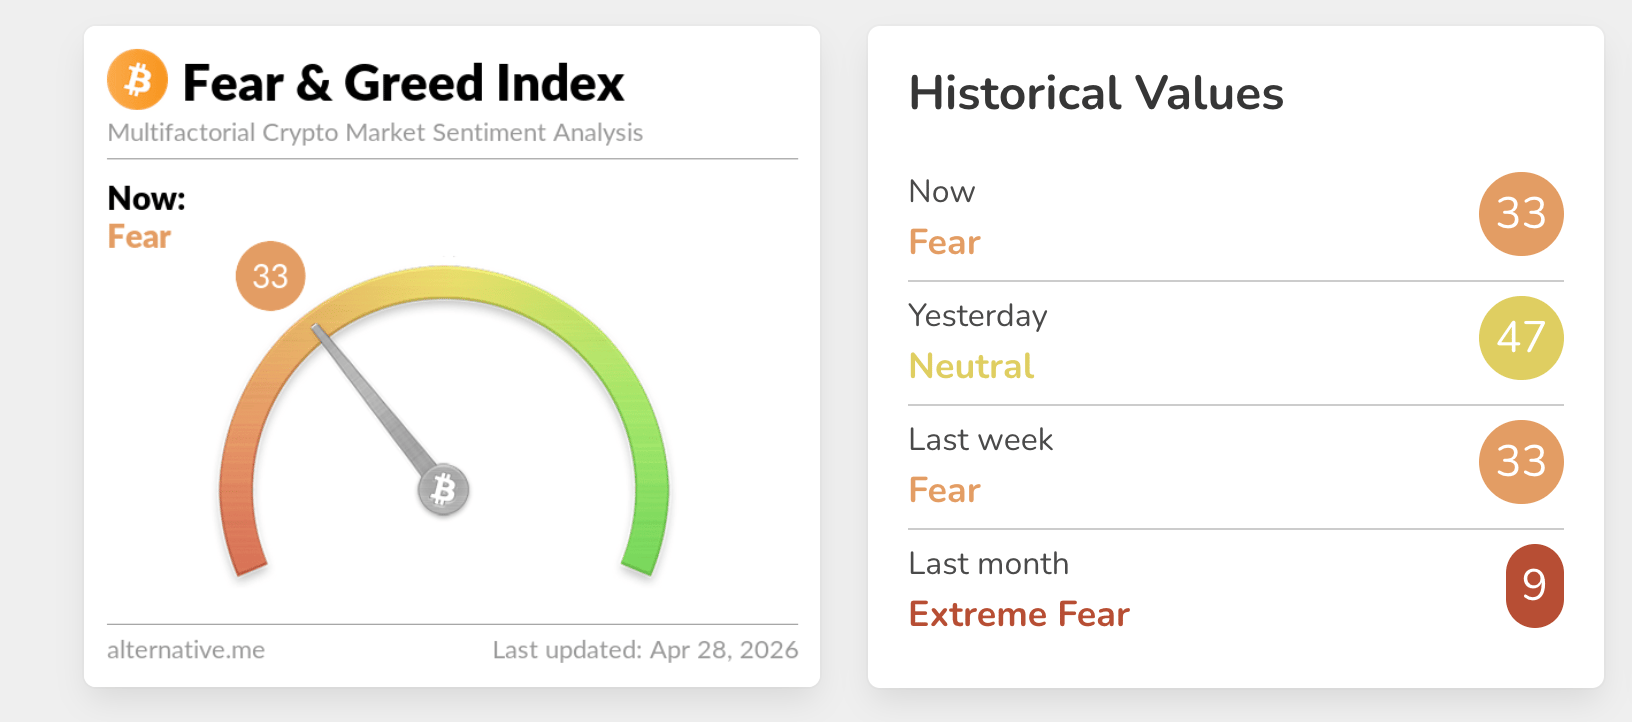
Sentiment across the crypto market has deteriorated, with the Fear & Greed Index falling to 33 on Tuesday, from 47 the previous day. In other words, investors remain cautious, limiting exposure to risky assets.
Market participants could also be sitting on the fence ahead of the Federal Reserve (Fed) monetary policy decision on Wednesday. Although the central bank is largely expected to leave interest rates unchanged in the 3.50%–3.75% range, attention will likely shift to Fed Chair Jerome Powell’s post-meeting press conference.
Investors will be looking closely at Powell’s remarks for clues on policy direction, especially amid the ongoing Middle East conflict and rising inflation.
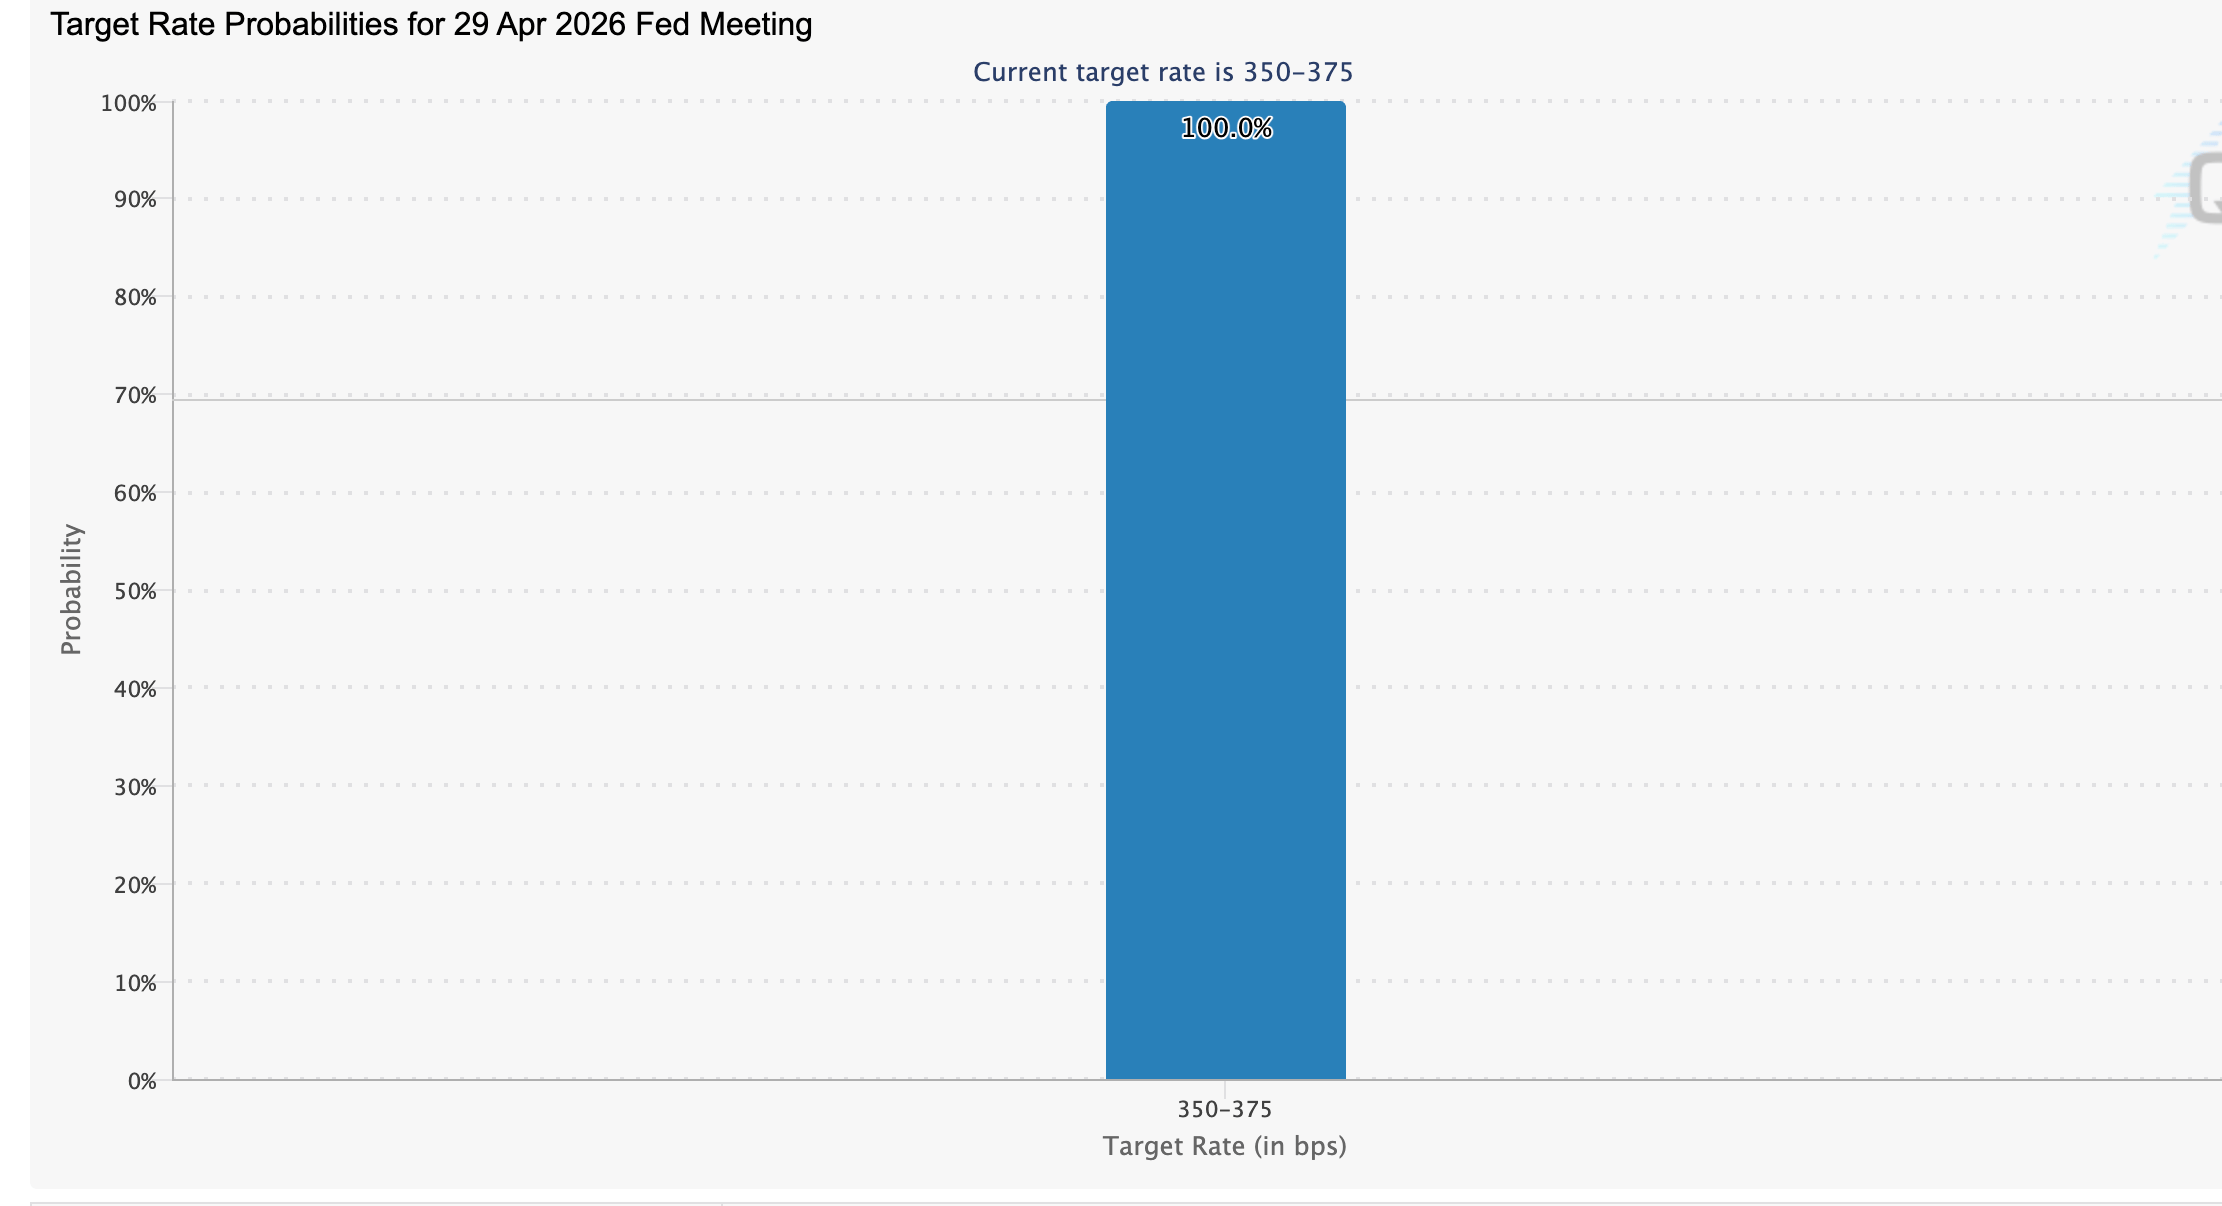
Chart of the day: Bitcoin drops as bears tighten grip
Bitcoin trades at $76,923, holding between its medium-term supports and the longer-term Exponential Moving Average (EMA) structures. The price remains above the 50-day EMA around $73,492 and the 100-day EMA near $75,644, suggesting underlying dip-buying interest, while still trading below the 200-day EMA at about $82,427, which caps the broader upside.
Momentum conditions are mildly constructive, with the Relative Strength Index (RSI) hovering at 58 on the daily chart and the Moving Average Convergence Divergence (MACD) histogram marginally above zero.
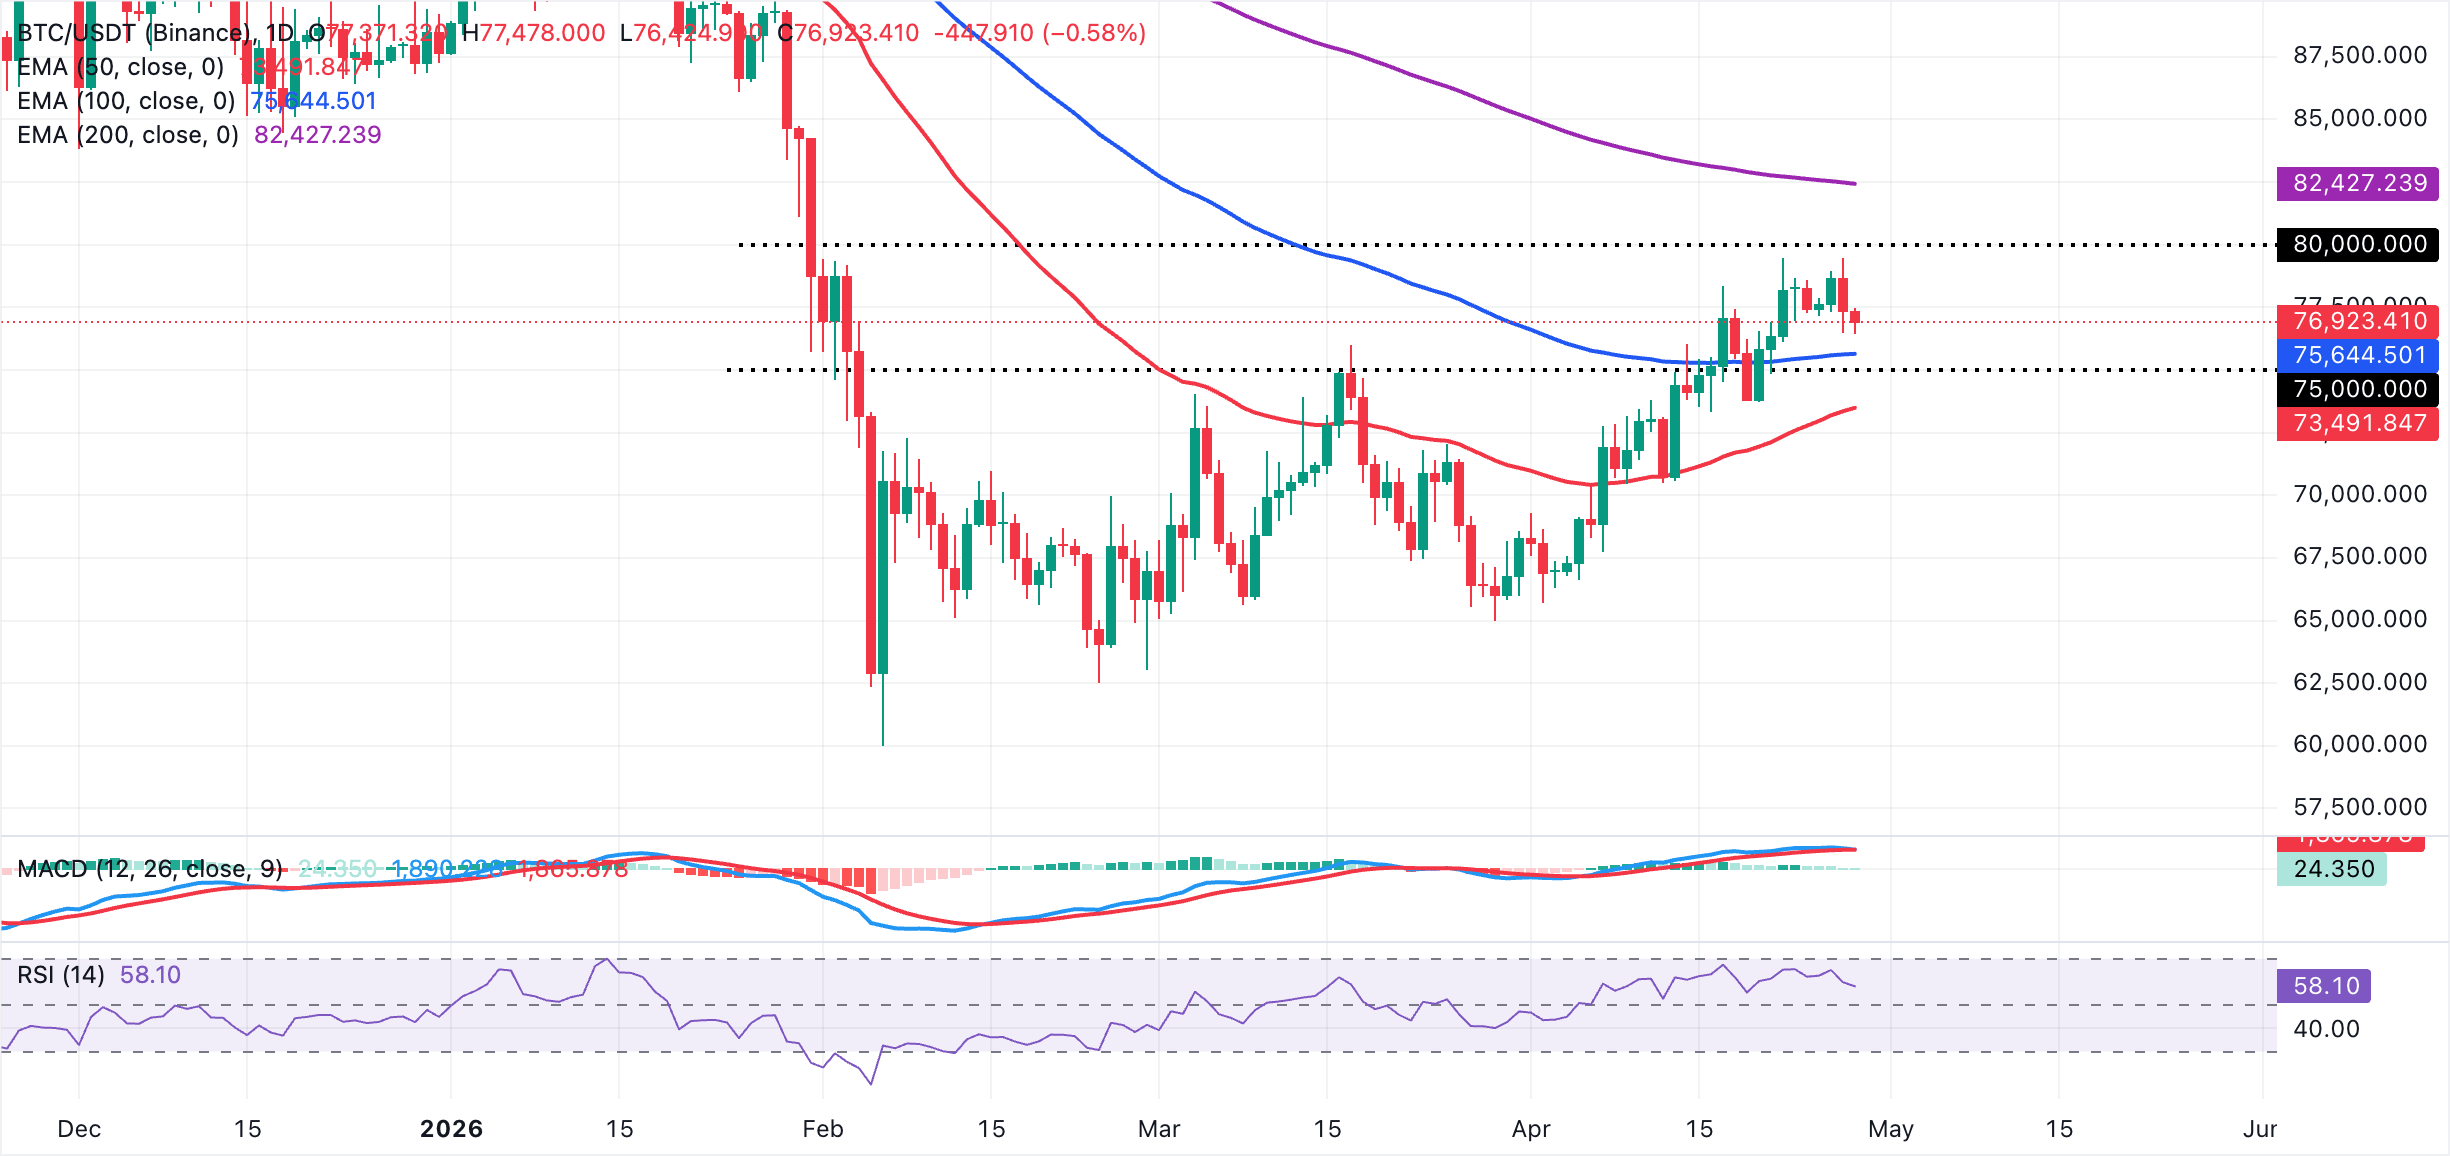
On the downside, initial support is at the 100-day EMA around $75,644, with a deeper cushion at the 50-day EMA near $73,492 if sellers extend the pullback. On the topside, the 200-day EMA at approximately $82,427 stands as the next major resistance, and bulls would need a sustained break above this longer-term average to tilt the broader structure back in their favor.
Altcoins technical outlook: Ethereum and XRP face increasing downside pressure
Ethereum trades at $2,287, holding between its short- and medium-term moving averages and keeping a neutral to slightly bearish tone. Its price trades above the 50-day EMA at $2,243, which lends initial support, but remains capped below the 100-day EMA at $2,351 and well under the 200-day EMA near $2,565, suggesting the broader recovery is still constrained by overhead supply.
Meanwhile, the MACD histogram sits in negative territory and is declining on the daily chart, hinting that upside momentum is fading, while the RSI around 51 signals balanced conditions after the recent pullback.
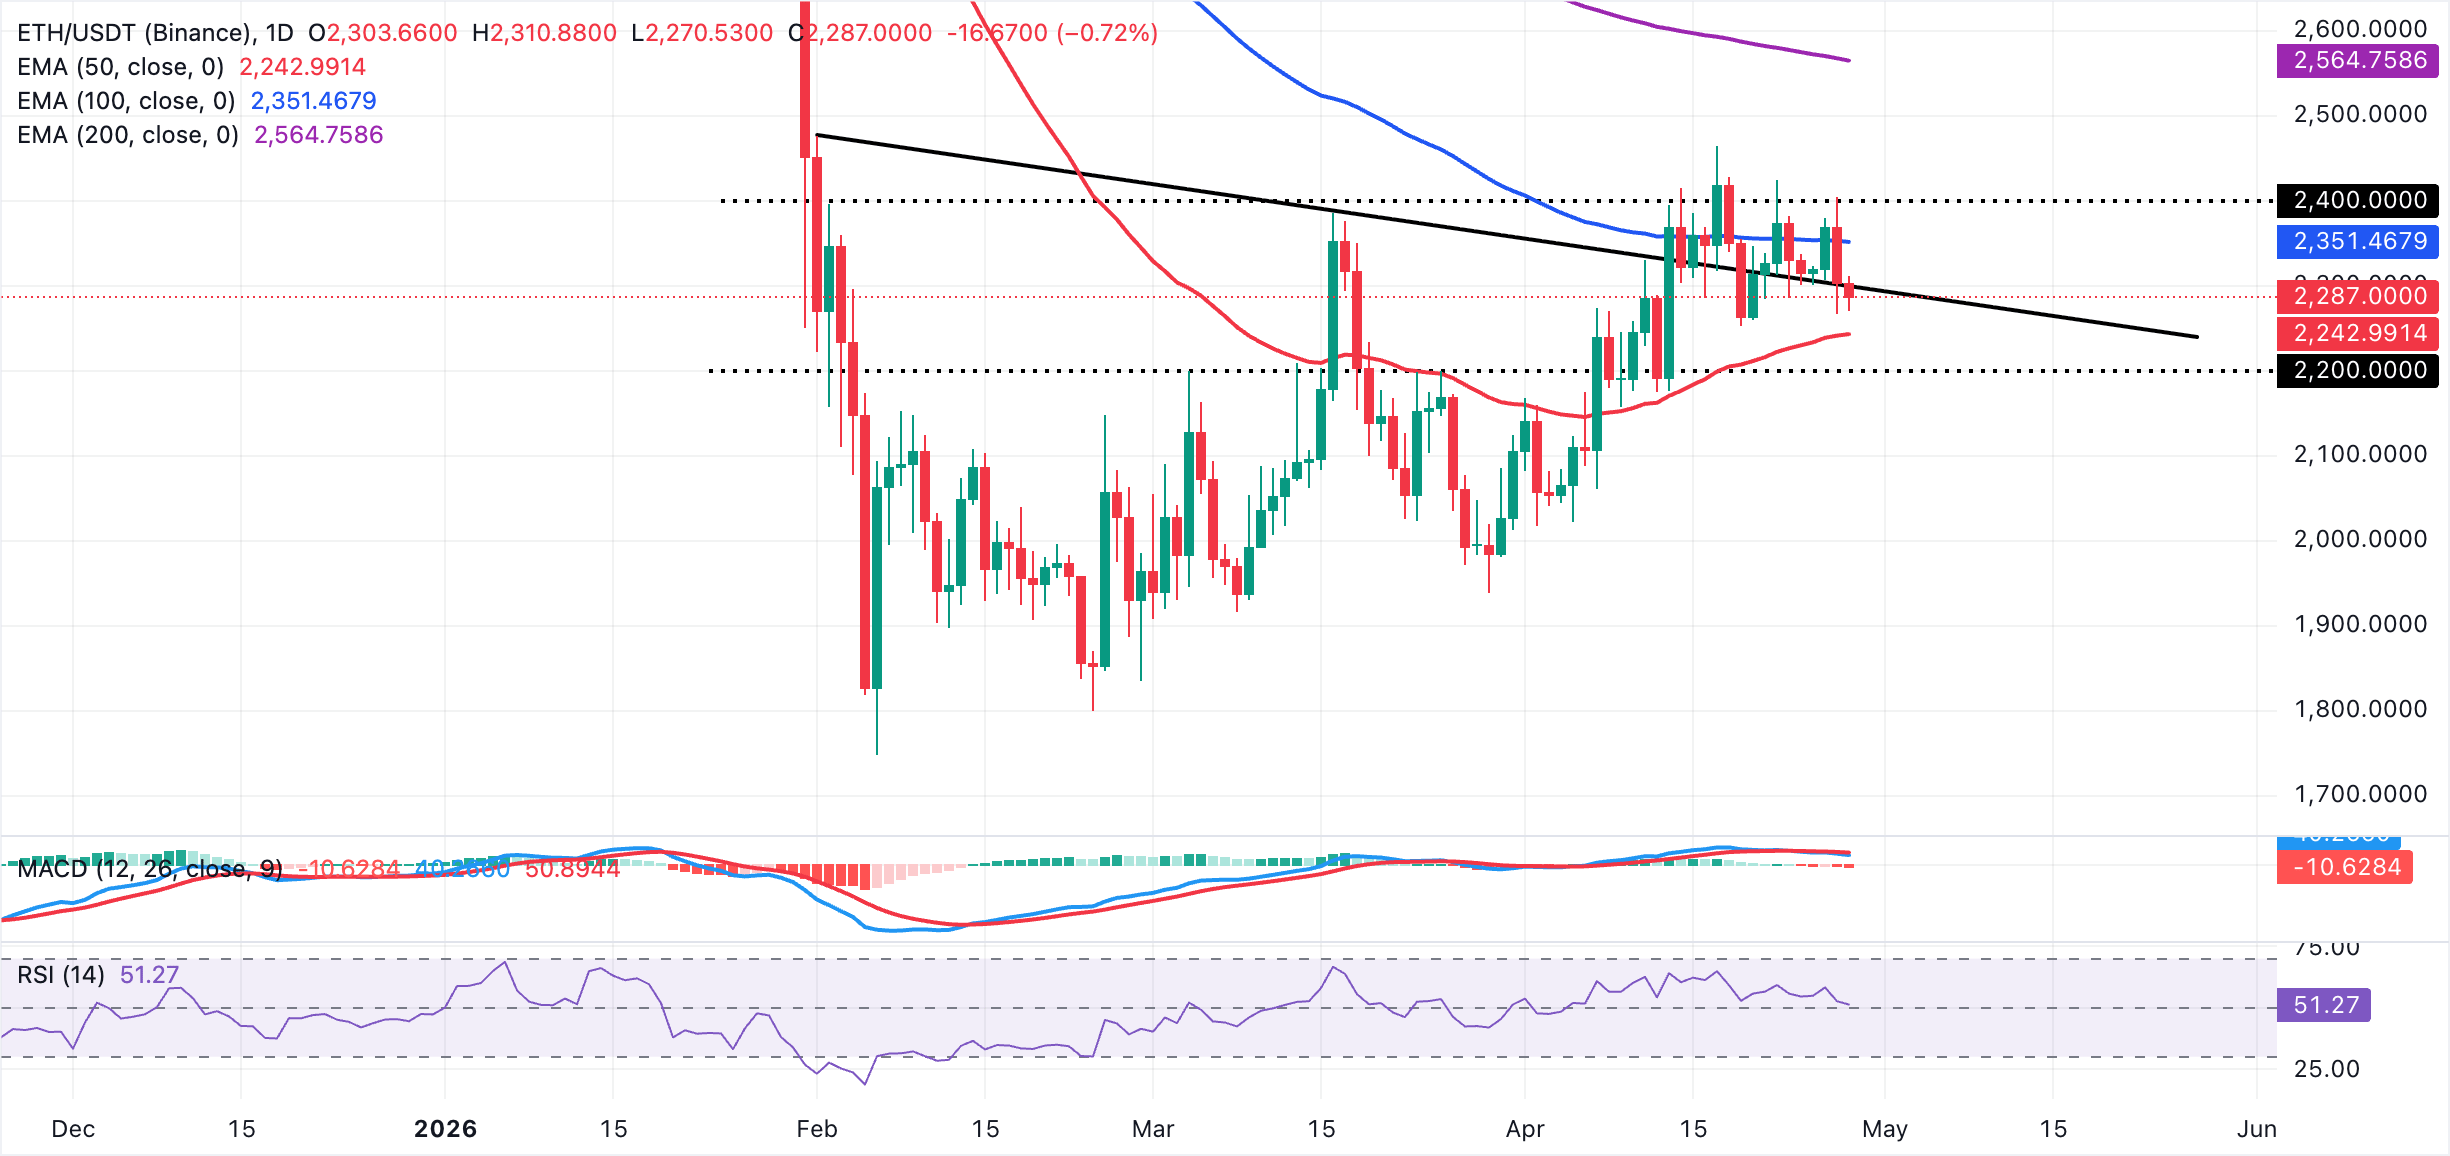
On the topside, immediate resistance is seen near the prior trendline break zone around $2,300, where a failure to sustain gains would reinforce the idea of a capped market. The 100-day EMA at $2,351 is a more meaningful barrier. A daily close above that area would be needed to expose the horizontal supply at $2,400 and the 200-day EMA around $2,565.
On the downside, the 50-day EMA at $2,243 serves as the first line of support, and a drop back below this level would open the door to a deeper retracement, shifting focus to lower chart supports such as the demand area at $2,200.
As for XRP, the price trades at $1.39 and remains in a capped structure below the Bollinger Bands’ Simple Moving Average (EMA) at roughly $1.40 and the 50-day EMA near $1.41, which together define immediate overhead supply. The 100-day and 200-day EMAs, at about $1.53 and $1.75 respectively, stay well above spot and reinforce a broader bearish bias.
Momentum signals are mixed, with the RSI hovering just below the neutral 50 midline on the daily chart and the MACD fractionally negative, hinting that upside attempts could continue to struggle beneath these moving average barriers.
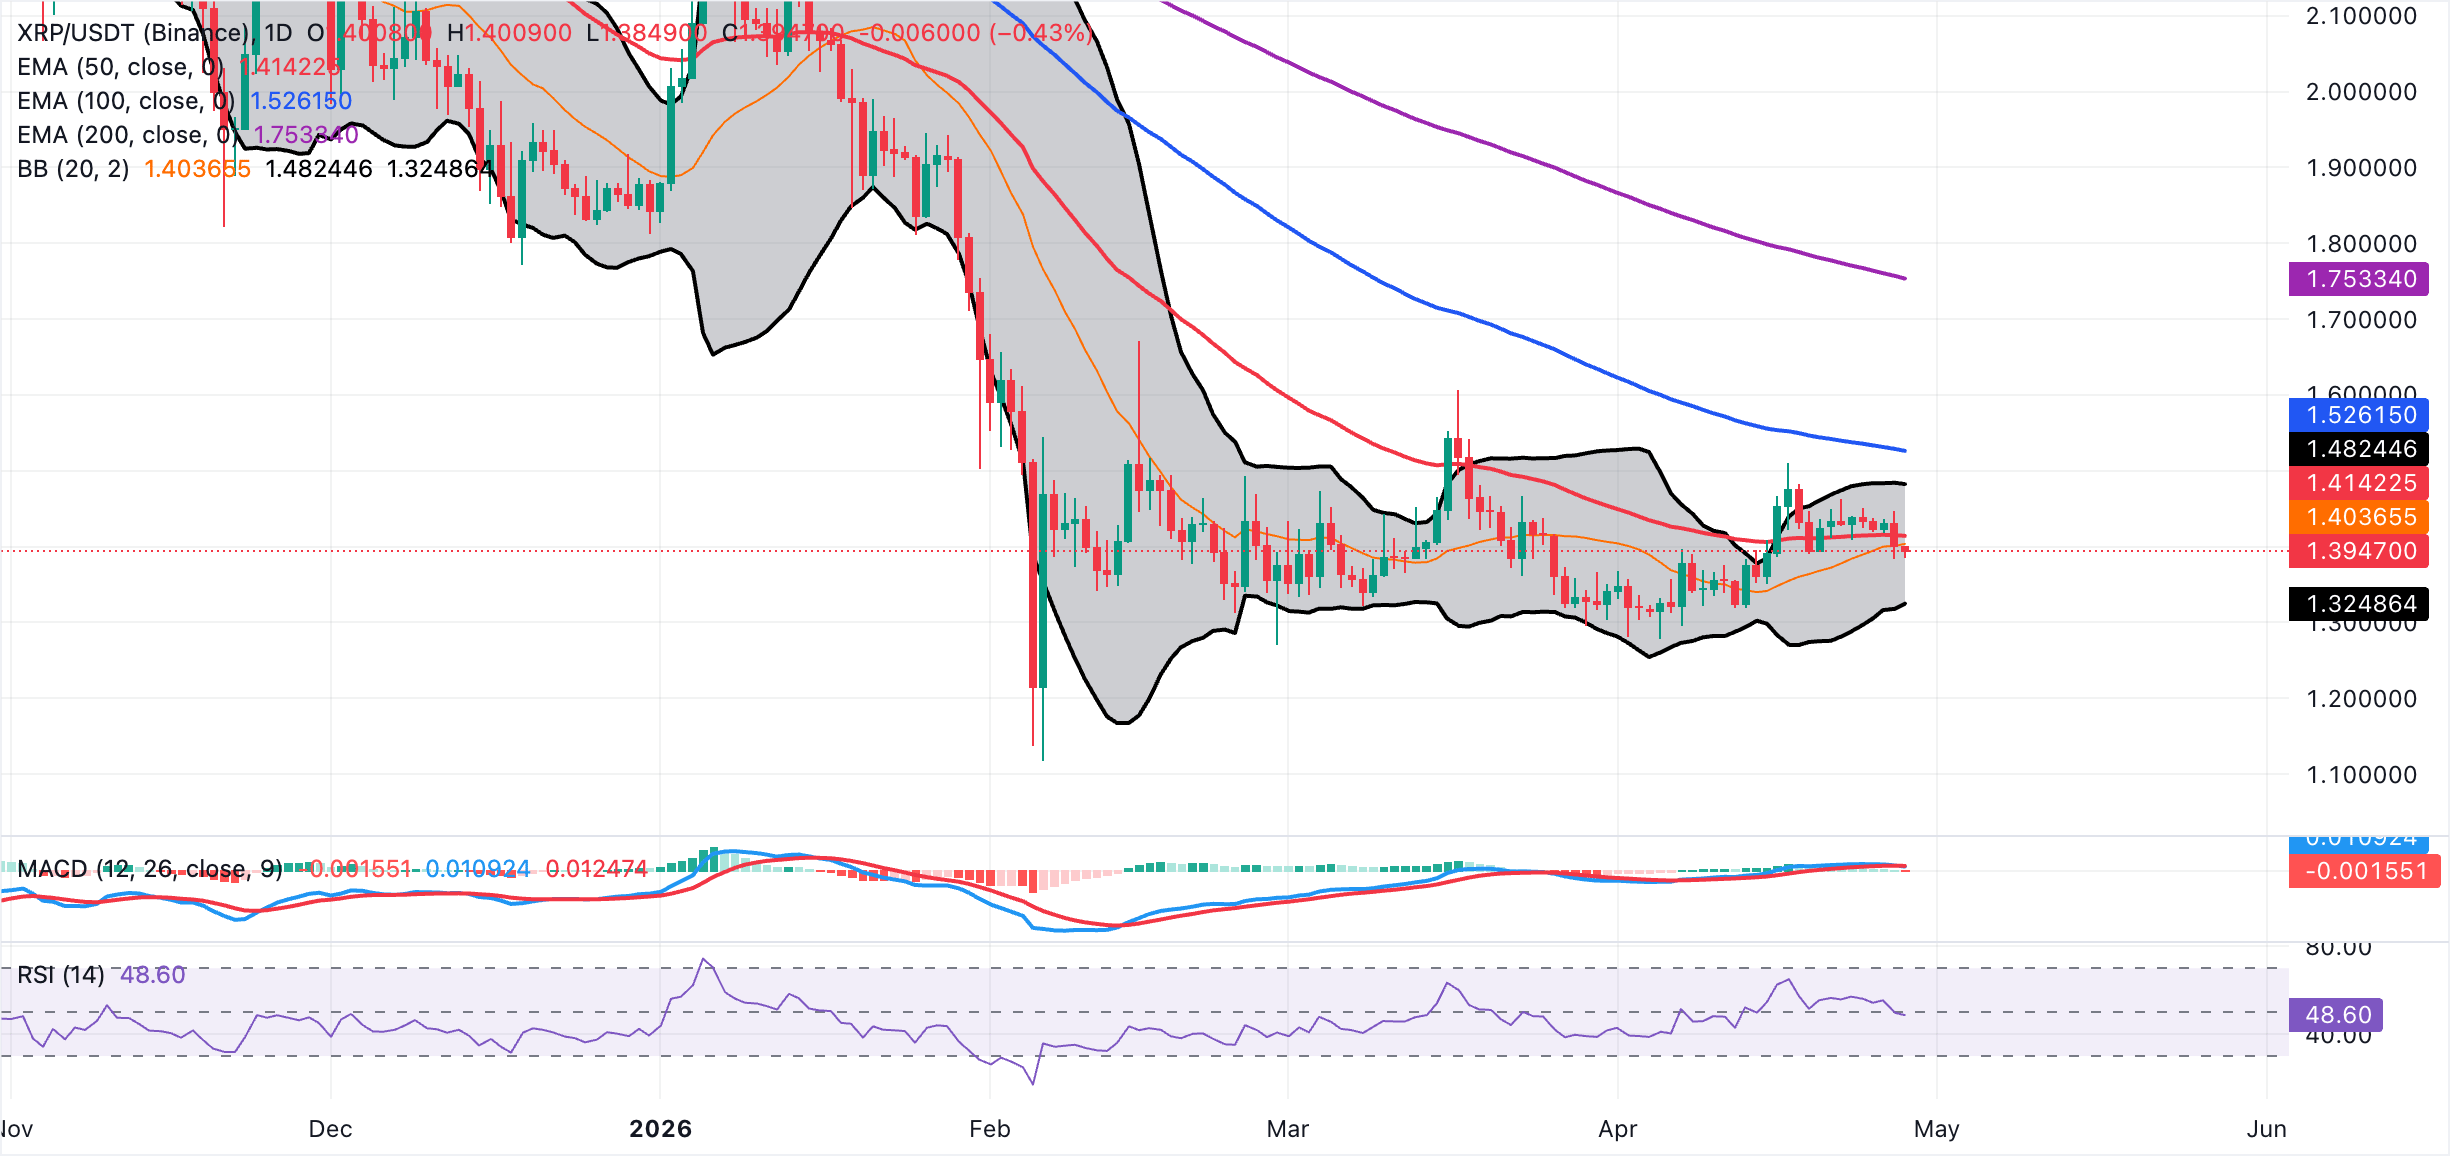
On the topside, initial resistance emerges at the Bollinger midline boundary around $1.40, followed closely by the 50-day EMA at $1.41. A sustained break above this clustered band would be needed to ease the current downside pressure and open the way toward the upper Bollinger band near $1.48.
Beyond that supply range, the 100-day EMA at approximately $1.53 and the 200-day EMA around $1.75 form successive, more distant resistance layers. On the downside, the lower Bollinger band at about $1.33 provides the nearest support, and a clear break below it would expose XRP to a deeper pullback.
(The technical analysis of this story was written with the help of an AI tool.)
Open Interest, funding rate FAQs
Higher Open Interest is associated with higher liquidity and new capital inflow to the market. This is considered the equivalent of increase in efficiency and the ongoing trend continues. When Open Interest decreases, it is considered a sign of liquidation in the market, investors are leaving and the overall demand for an asset is on a decline, fueling a bearish sentiment among investors.
Funding fees bridge the difference between spot prices and prices of futures contracts of an asset by increasing liquidation risks faced by traders. A consistently high and positive funding rate implies there is a bullish sentiment among market participants and there is an expectation of a price hike. A consistently negative funding rate for an asset implies a bearish sentiment, indicating that traders expect the cryptocurrency’s price to fall and a bearish trend reversal is likely to occur.
Author

John Isige
FXStreet
John Isige is a seasoned cryptocurrency journalist and markets analyst committed to delivering high-quality, actionable insights tailored to traders, investors, and crypto enthusiasts. He enjoys deep dives into emerging Web3 tren


