Ripple and Stellar outlook: Momentum improves as bulls target further gains
- XRP hovers around $1.518 on Tuesday after gaining nearly 9% the previous day.
- XLM claims $0.213 after surging over 9% on Monday.
- Strengthening momentum indicators support further gains while mixed derivatives metrics could cap upside potential.

Ripple (XRP) and Stellar (XLM) stabilize on Tuesday after extending their gains by nearly 9% at the start of the week on Monday. Improving momentum indicators support XRP and XLM bullish price action and hint at further rally. Meanwhile, traders should remain cautious as mixed derivatives data could limit upside as both tokens try to sustain their recent upswing.
Mixed derivatives metrics
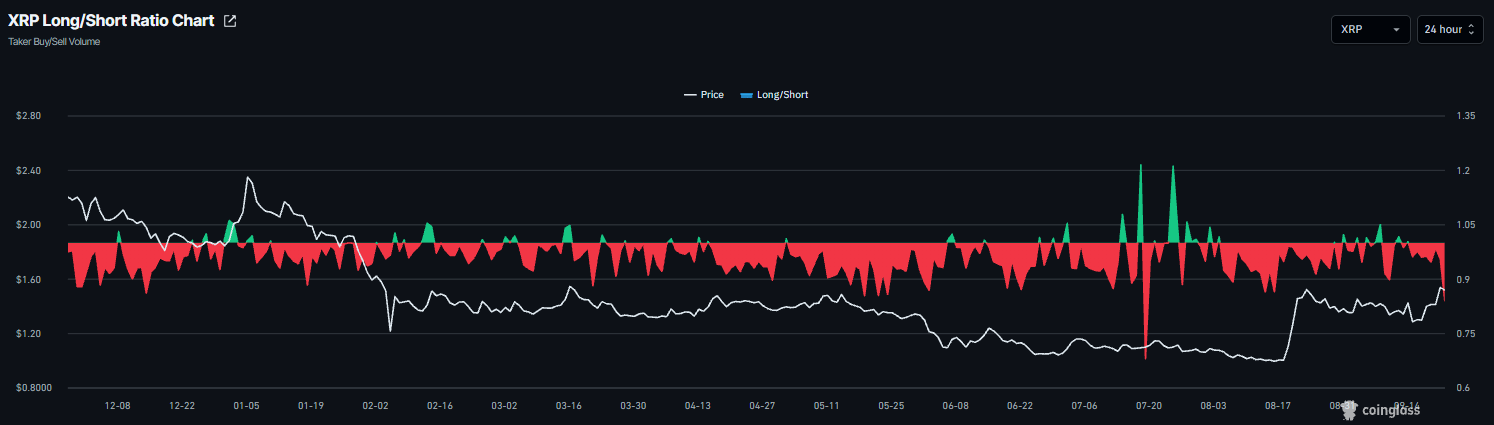
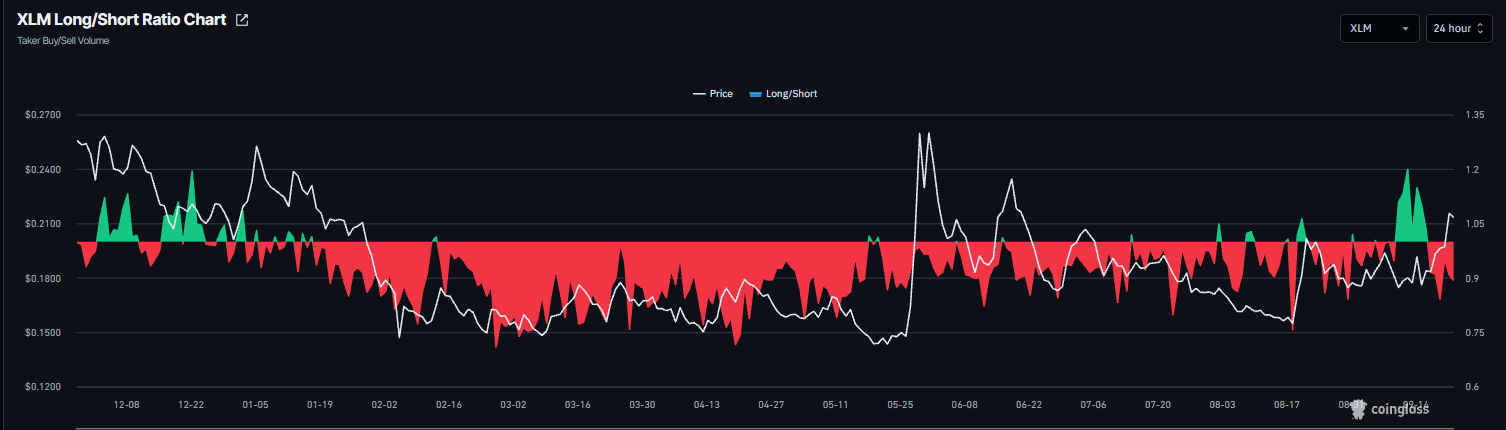
Derivatives data shows a mixed and cautious outlook among traders, despite recent gains in XRP and XLM. CoinGlass’ long-to-short ratios for Ripple and Stellar read 0.86 and 0.89, respectively, on Tuesday, nearing their lowest levels in a month. A ratio below one indicates bearish sentiment, as traders bet that asset prices will fall.
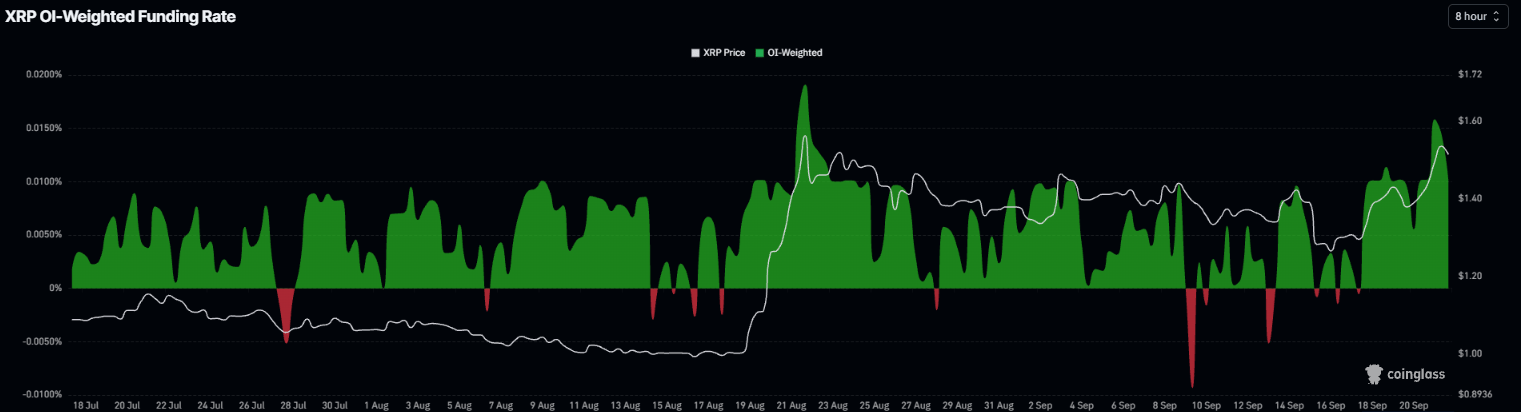
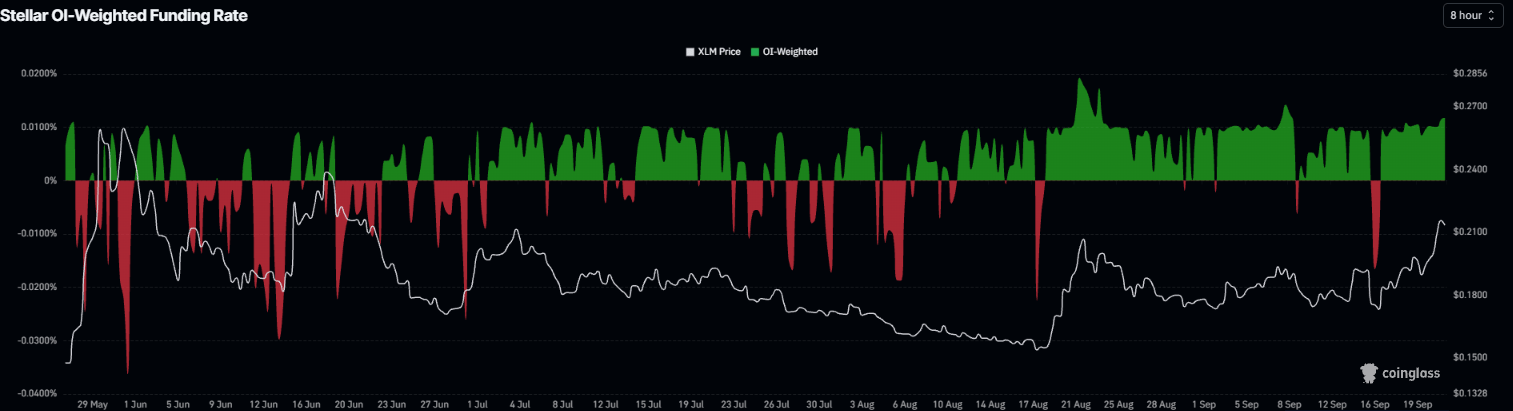
However, the funding rates for both altcoins support a bullish outlook. The XRP funding rate flipped positive on September 18 and surged to 0.010% on Tuesday. Similarly, the XLM funding rate flipped positive on September 16 and surged to 0.011% on Tuesday. These positive rates indicate longs are paying shorts, reflecting a bullish outlook for Ripple and Stellar.
XRP technical outlook: Surges after holding key level
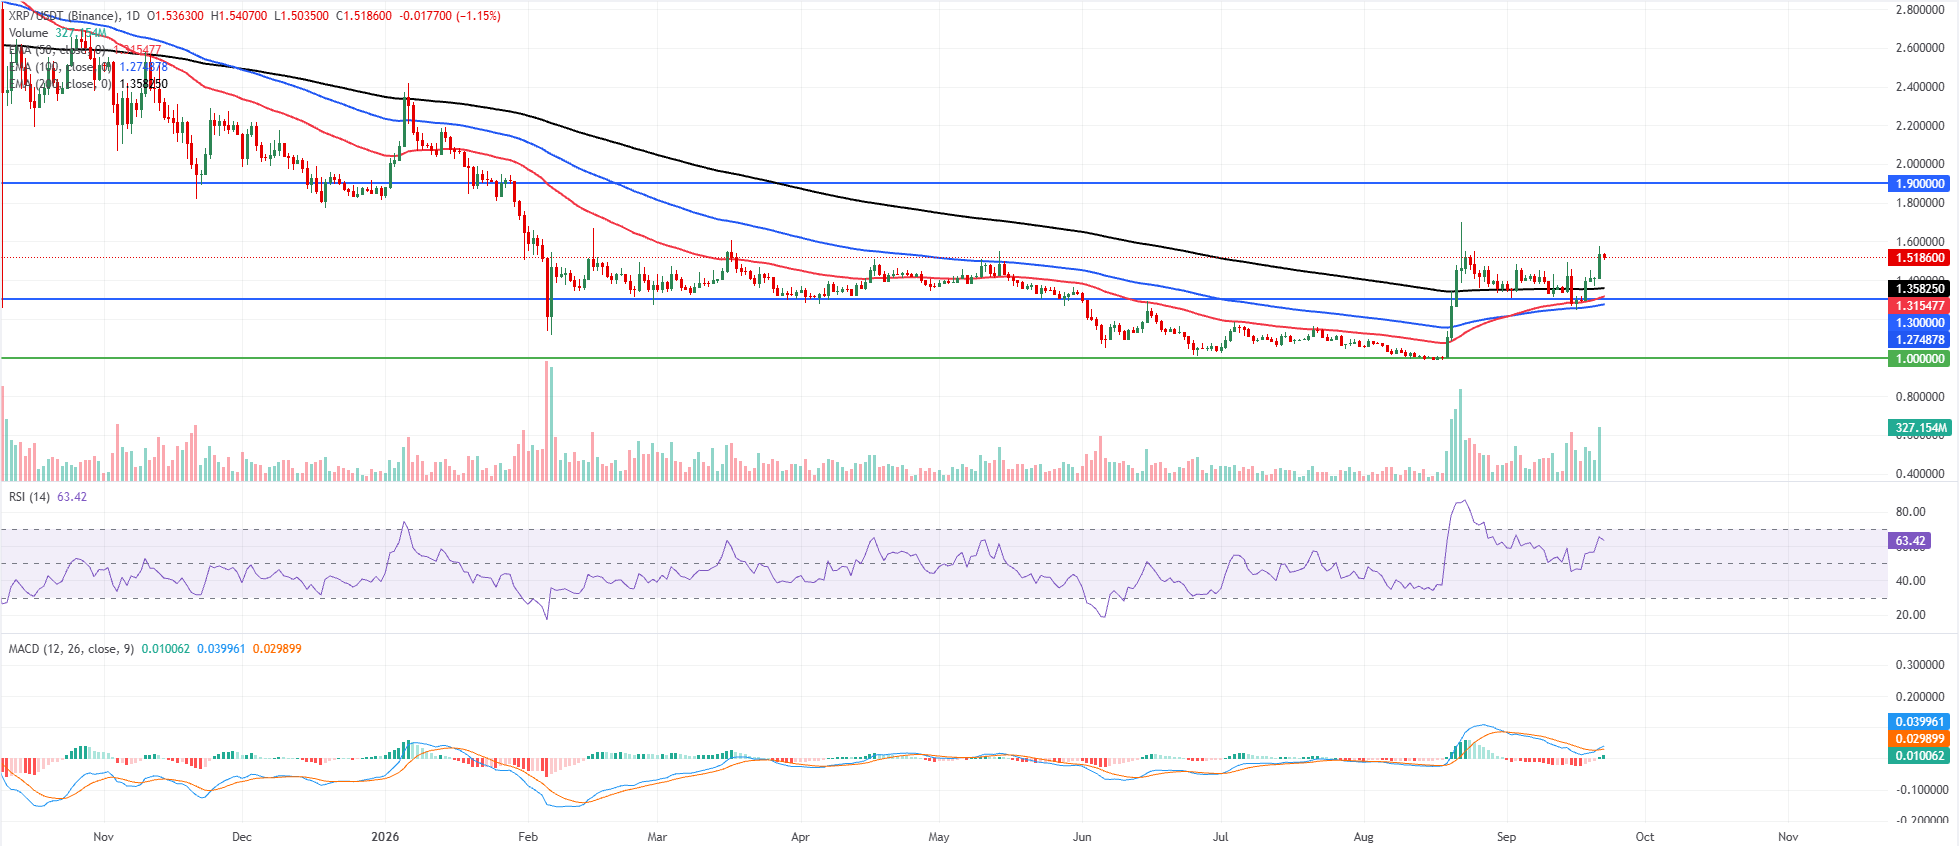
XRP price trades at $1.518 on Tuesday, extending its bullish bias as price holds well above the 50-day, 100-day, and 200-day Exponential Moving Averages (EMAs), clustered between roughly $1.274 and $1.358.
The rebound from recent lows has pushed the Relative Strength Index (RSI) to 63, indicating firm but not yet overbought momentum. At the same time, the Moving Average Convergence Divergence (MACD) has turned positive, hinting that buyers are regaining control after a period of consolidation.
On the downside, immediate support is at the 200-day EMA at $1.358, and the 50-day EMA at $1.315, with horizontal support at $1.300 reinforcing this zone; a deeper pullback could test the 100-day EMA at $1.274 before the major structural floor at $1.000.
On the topside, the next notable resistance aligns with the horizontal barrier at $1.900, where a sustained break would open the way for further gains in the broader uptrend.
XLM technical outlook: Strengthening momentum indicators
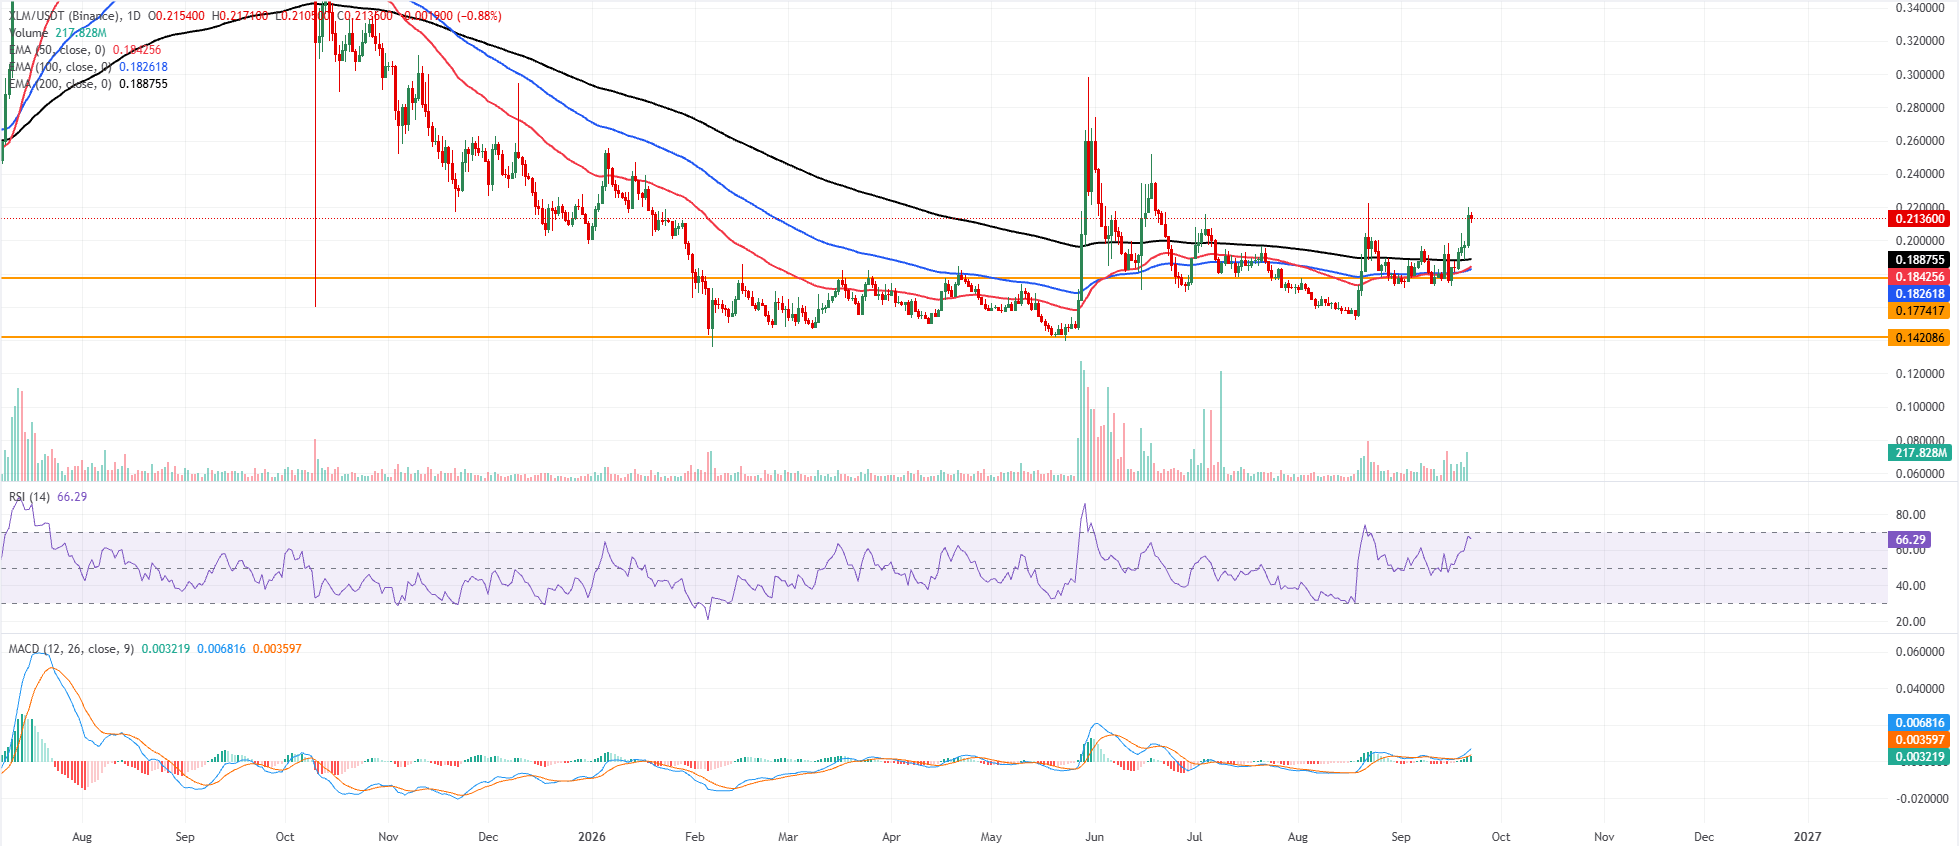
XLM price trades at $0.2135 on Tuesday after gaining over 9% the previous day. XLM maintains a clear bullish bias as price holds above the 50-day, 100-day, and 200-day EMAs, clustered between roughly $0.182 and $0.188.
The rising RSI near 66 and a positive MACD histogram both suggest strong upward momentum, reinforcing the view that the recent breakout is supported by underlying demand rather than a mere spike.
On the downside, initial support appears at the 200-day EMA near $0.188, followed by the short-term 50-day EMA around $0.184 and the 100-day EMA at $0.182, which together create a dense demand zone before the horizontal base at $0.177. A deeper pullback would expose the more distant structural floor near $0.142, but as long as XLM holds above the EMA cluster, buyers are likely to defend dips, keeping the path of least resistance pointed higher.
(The technical analysis of this story was written with the help of an AI tool. Know more.)
Author

Manish Chhetri
FXStreet
Manish Chhetri is a crypto specialist with over four years of experience in the cryptocurrency industry.