XRP extends rally as bullish technical signals underpin breakout attempt
- XRP extends gains for a second consecutive day, targeting a short-term breakout above the 100-day EMA.
- US-listed XRP spot ETFs post mild inflows of $2 million on Wednesday.
- XRP presents an improving technical structure, defined by an uptrending RSI and MACD buy signal.

Ripple (XRP) holds in bullish hands, as price action extends above $1.16 at the time of writing on Thursday. Since Monday, the cross-border remittance token has surged by more than 20%, reflecting a steady growth in risk-on sentiment.
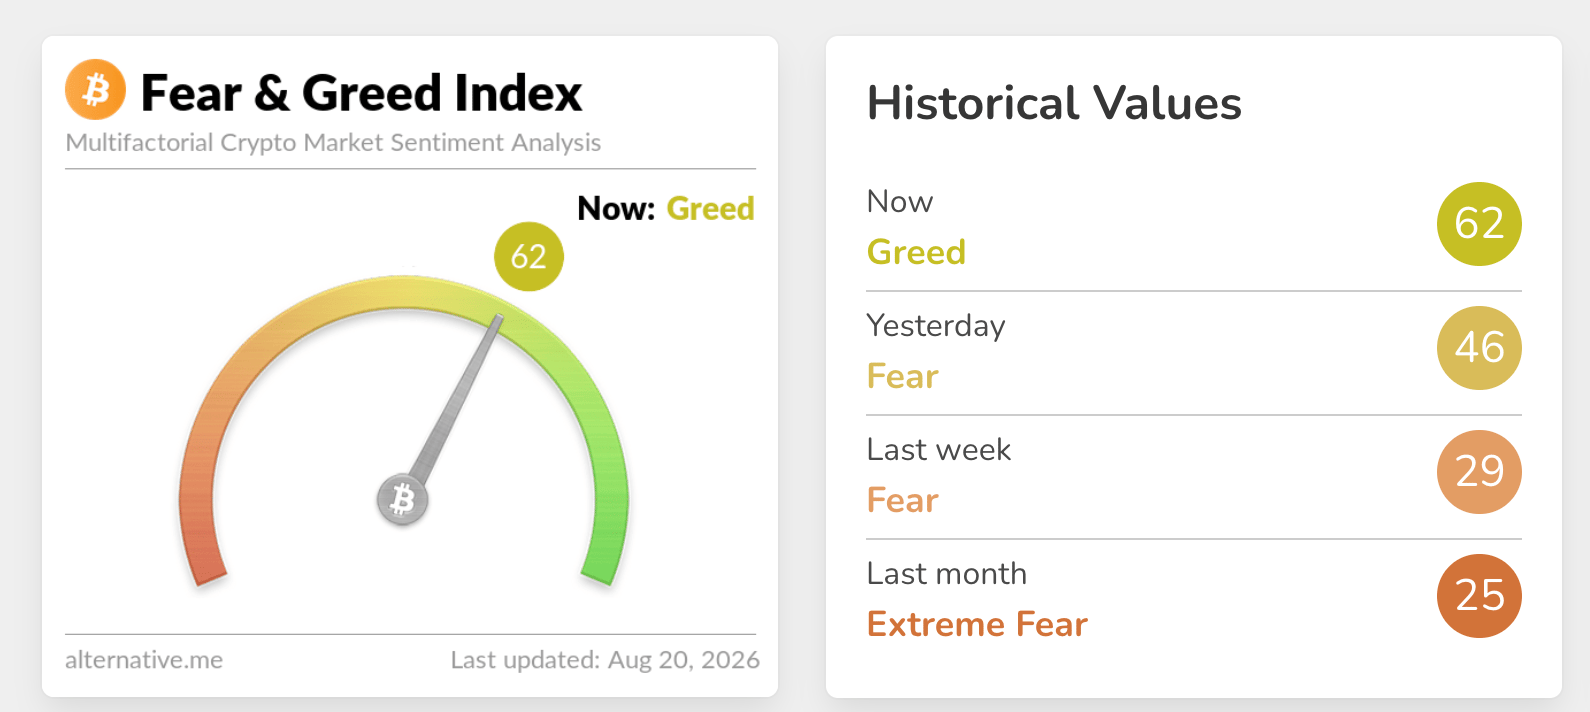
The broader crypto market sentiment is on an upward roll at 62 in the Greed territory on Thursday, up from 46 the previous day, according to the Fear & Greed Index. The index is now at the same level as in January, suggesting XRP appetite is growing.
XRP sees modest ETF inflows
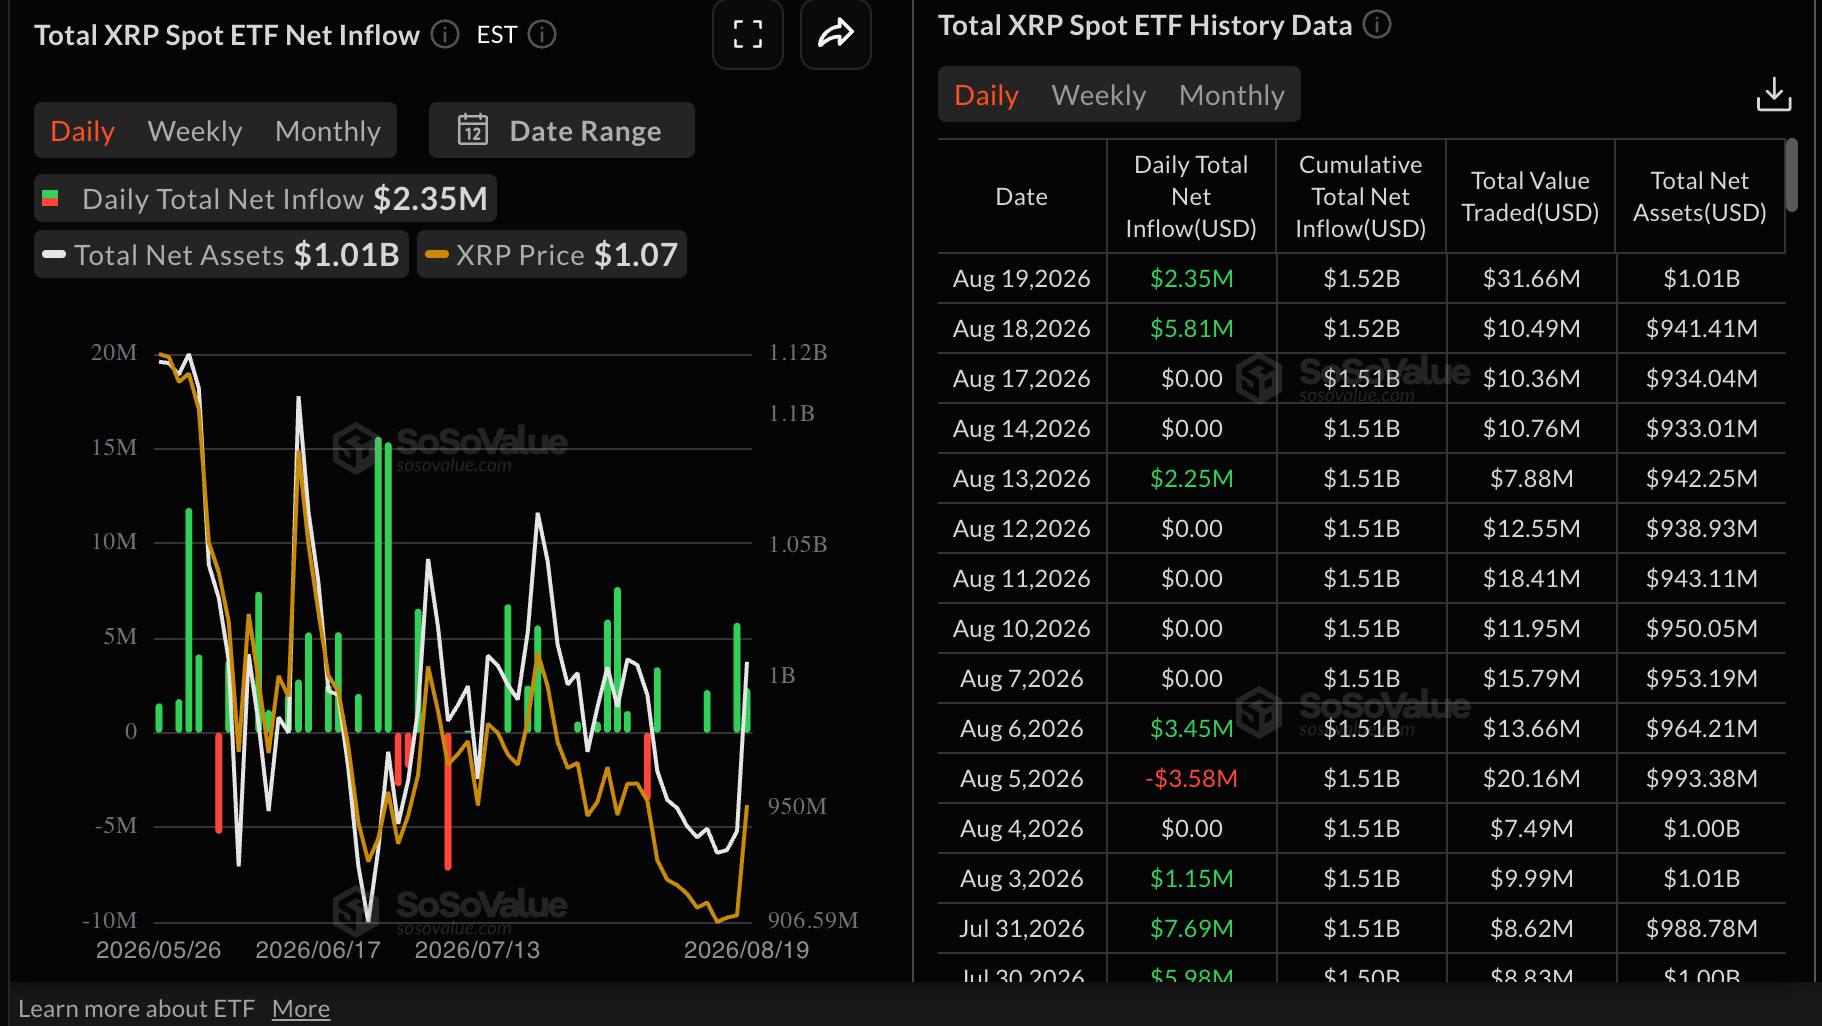
Institutional interest in XRP spot Exchange-Traded Funds (ETFs) has returned this week, with mild inflows totaling $2.35 million on Wednesday and $5.81 million on Tuesday. This follows an extended period of muted activity that aligned with the broader cryptocurrency market's doldrums.
Cumulative inflows now stand at $1.52 billion, with net assets averaging $1.01 billion, according to SoSoValue. This underpins a long-term investor outlook in XRP and related digital investment products.
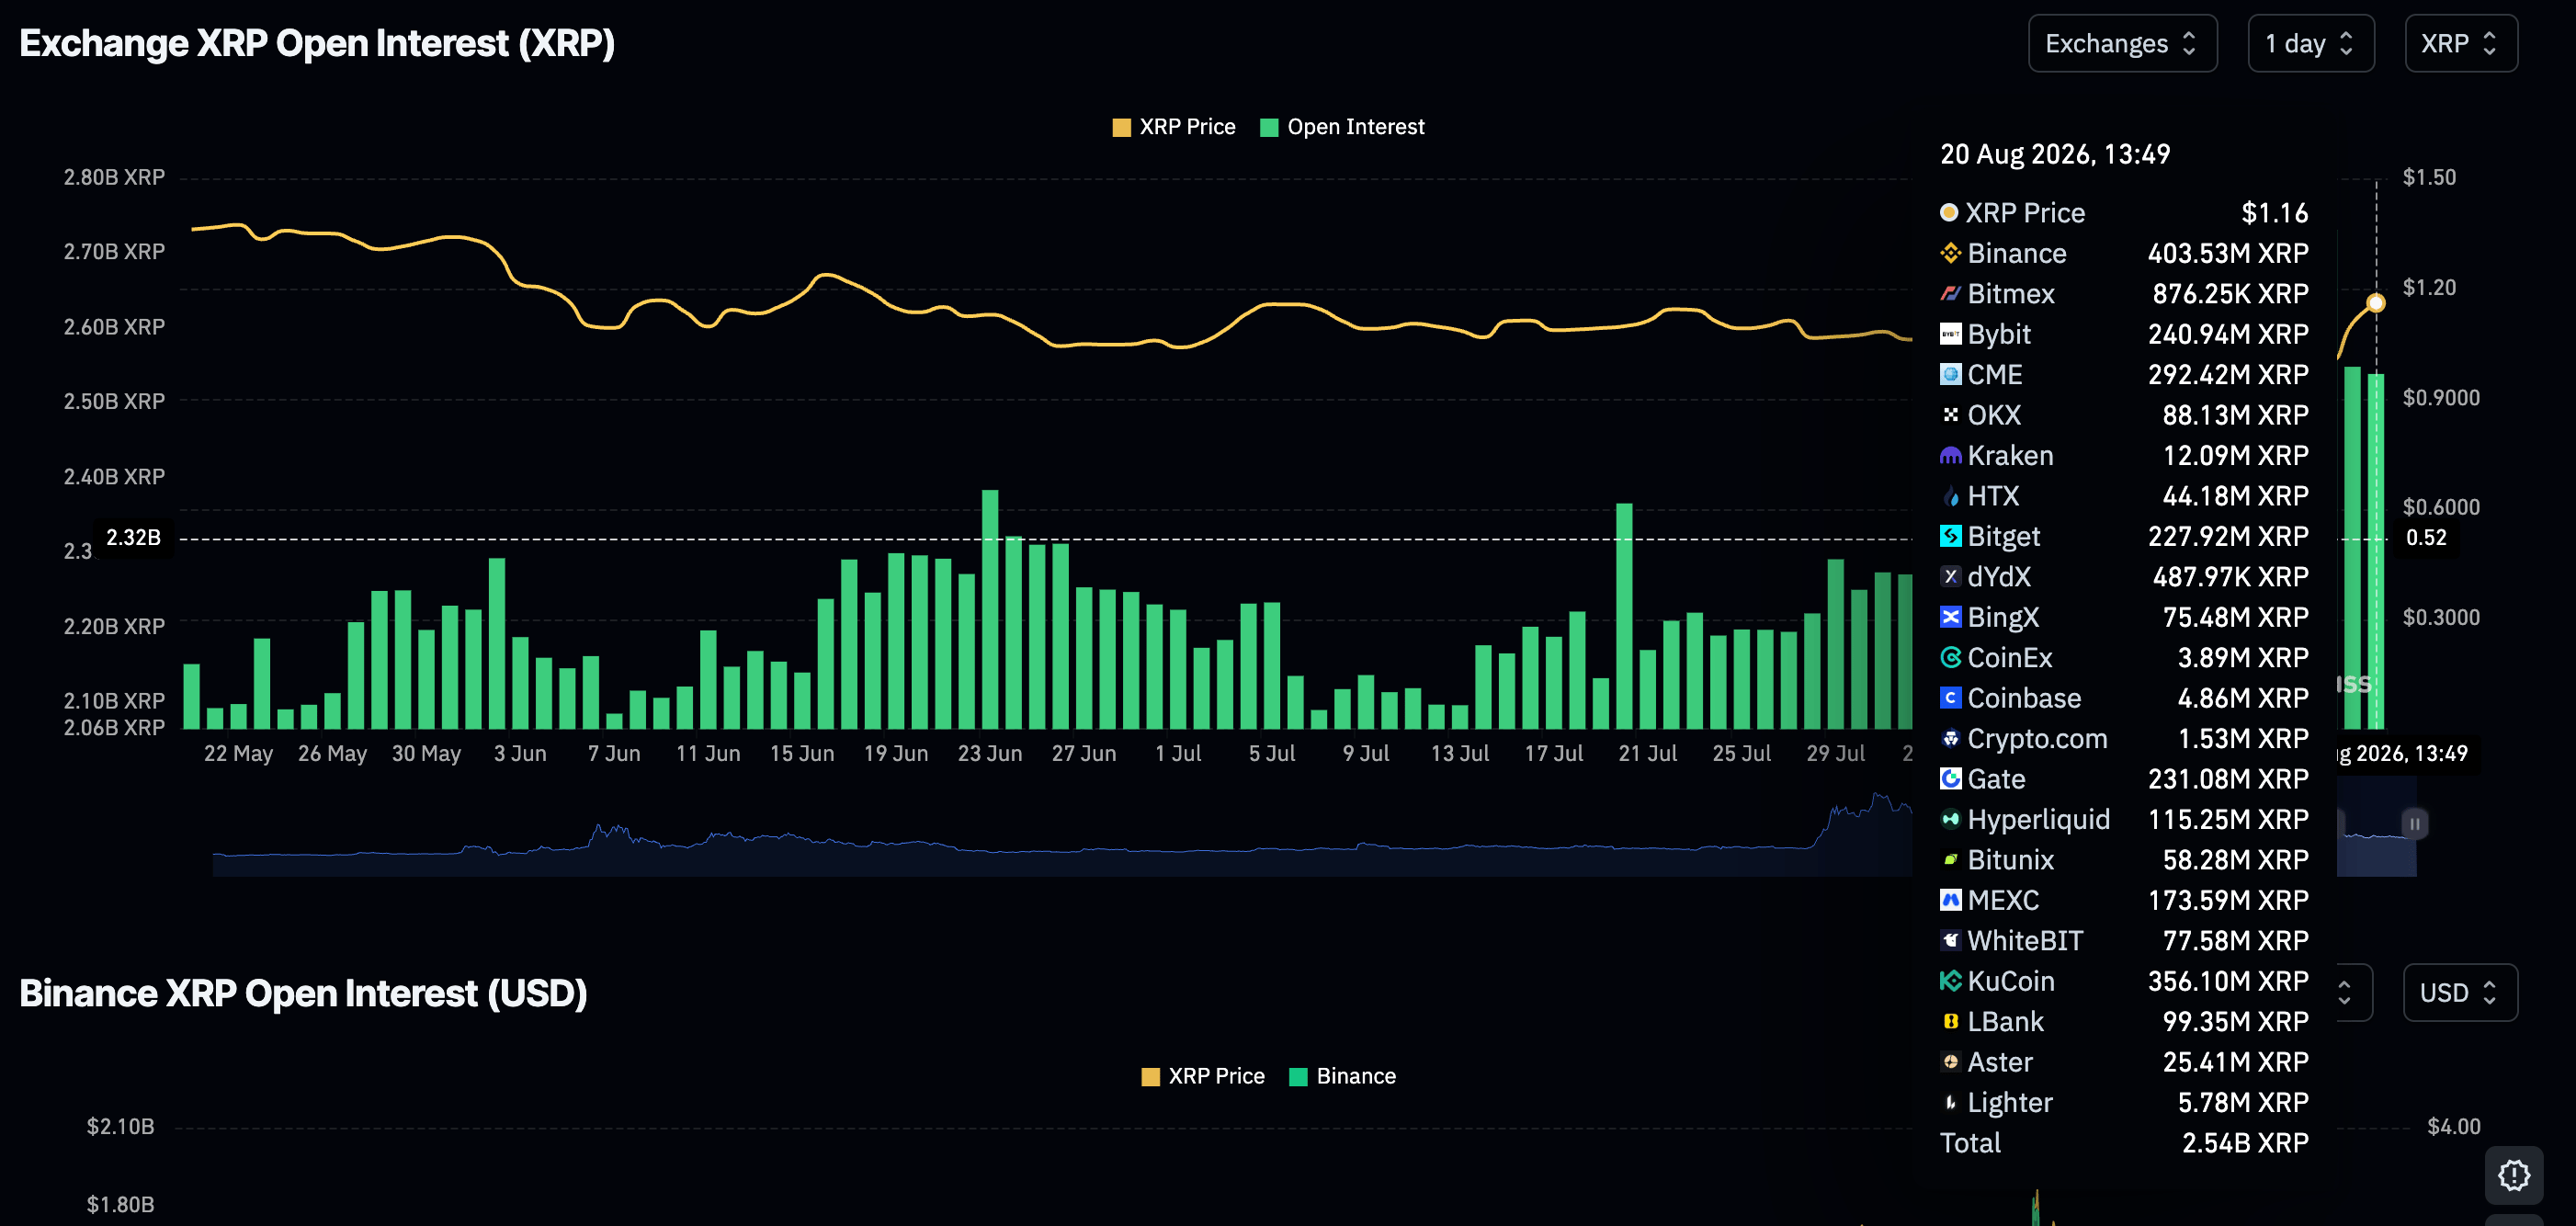
Still, the retail demand is lagging the bullish price action, as perpetual futures Open Interest (OI) declines to 2.54 billion XRP on Thursday, from 2.73 billion the previous day. If OI fails to catch up with the price increase, a pullback could follow as the market stabilizes before the next leg.
Technical analysis: XRP builds momentum
XRP trades at $1.16, holding a bullish near-term bias as the spot price stands above the key short and medium-term Exponential Moving Averages (EMAs). The 50-day Exponential Moving Average (EMA) at $1.08 and the 100-day EMA at $1.15 underpin the advance as layered support, while the SuperTrend indicator at $1.01 reinforces the broader constructive structure after the recent breakout.
Momentum is supportive, with the Relative Strength Index (RSI) hovering just below overbought territory near 70 and the Moving Average Convergence Divergence (MACD) above zero with a strengthening positive reading, suggesting buyers retain control. However, the rally appears stretched at these levels.
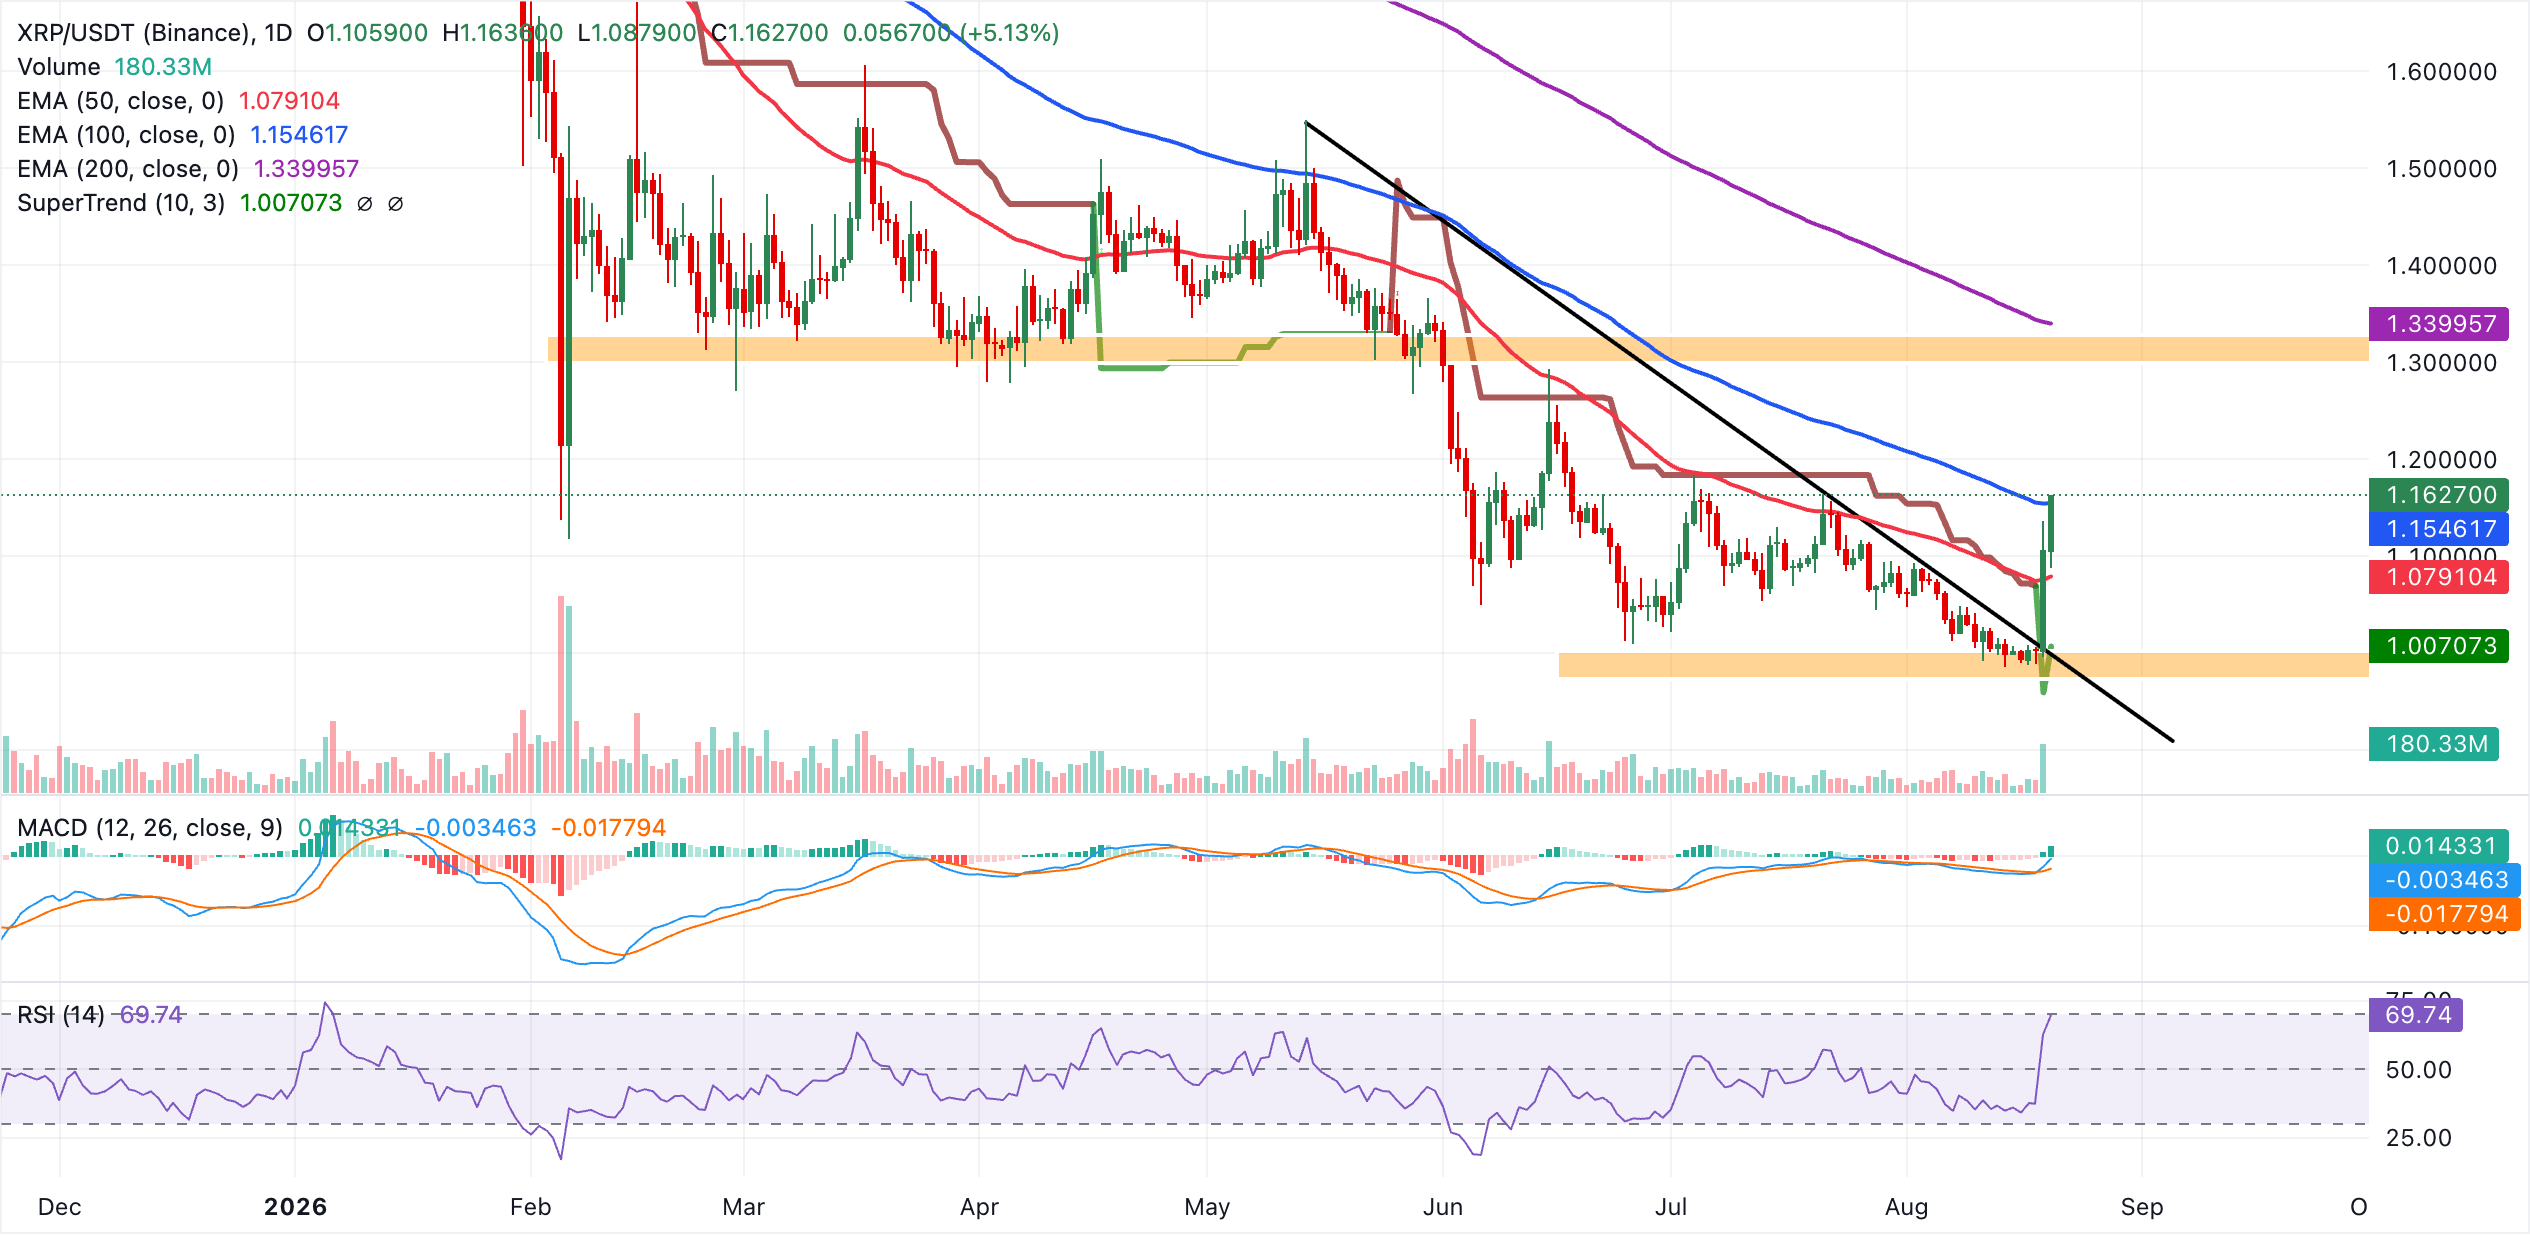
The next significant obstacle is the 200-day EMA, now tracking near $1.34, the first major resistance level and a potential cap for further gains unless decisively reclaimed. On the downside, initial support is at the 100-day EMA at $1.15, with additional support from the 50-day EMA at $1.08 and the SuperTrend line around $1.01, where a deeper pullback would likely attract dip-buying interest. As long as XRP holds above these clustered daily supports, the technical tone would favor further upside probes toward the 200-day EMA, even if short-term consolidation is needed to alleviate overbought readings.
(The technical analysis of this story was written with the help of an AI tool. Know more.)
Open Interest, funding rate FAQs
Higher Open Interest is associated with higher liquidity and new capital inflow to the market. This is considered the equivalent of increase in efficiency and the ongoing trend continues. When Open Interest decreases, it is considered a sign of liquidation in the market, investors are leaving and the overall demand for an asset is on a decline, fueling a bearish sentiment among investors.
Funding fees bridge the difference between spot prices and prices of futures contracts of an asset by increasing liquidation risks faced by traders. A consistently high and positive funding rate implies there is a bullish sentiment among market participants and there is an expectation of a price hike. A consistently negative funding rate for an asset implies a bearish sentiment, indicating that traders expect the cryptocurrency’s price to fall and a bearish trend reversal is likely to occur.
Author

John Isige
FXStreet
John Isige is a seasoned cryptocurrency journalist and markets analyst committed to delivering high-quality, actionable insights tailored to traders, investors, and crypto enthusiasts. He enjoys deep dives into emerging Web3 tren