Ripple Elliott Wave technical analysis [Video]
![Ripple Elliott Wave technical analysis [Video]](https://editorial.fxsstatic.com/images/i/XRP-bullish-realistic.png)
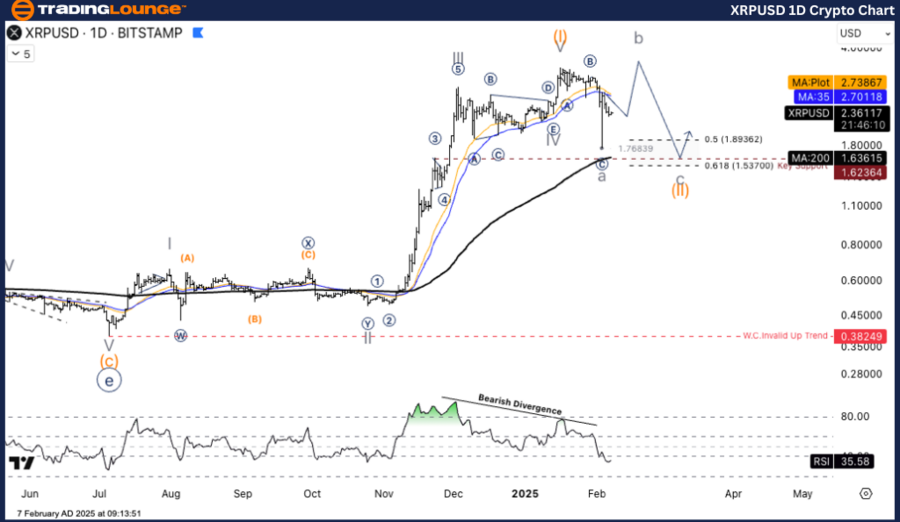
XRP/USD Elliott Wave technical analysis
Function: Counter Trend.
Mode: Corrective.
Structure: Flat.
Position: Wave ((B)).
Direction next higher degrees: Wave IV.
Wave cancel invalid level:
XRP/ U.S. dollar(XRPUSD)Trading Strategy: XRPUSD is in a wave II structure, which is a corrective wave. After the end of wave I, wave II is expected to form a corrective ABC structure. Currently, the price is in the sub-wave b of this structure. After the end of wave b, the price is expected to correct down to the end of wave c of wave II.
Trading strategies
Buy strategy (long position):
- Wait for the price to adjust down to the support zone of 1.8936 - 1.5370 and look for an opportunity to open a buy position.
Risk management:
- Set Stop Loss below 1.5000 level.
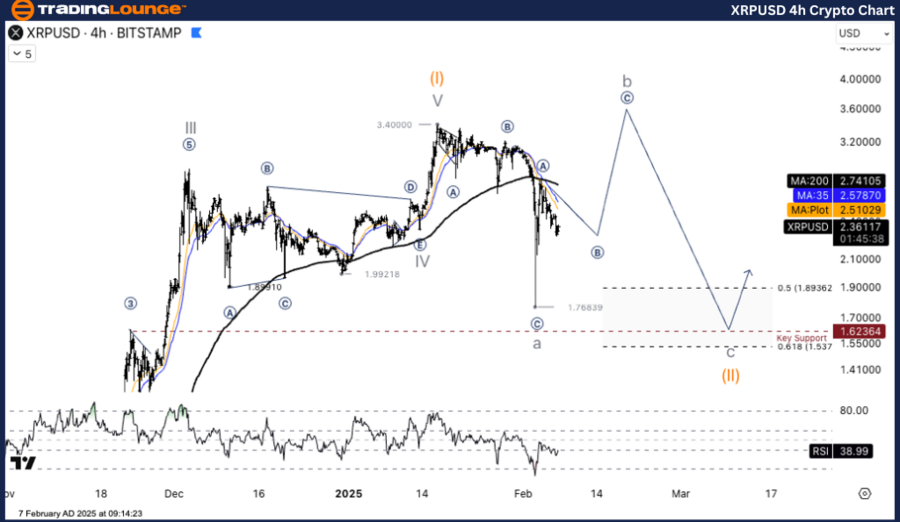
XRP/USD Elliott Wave technical analysis
Function: Follow Trend.
Mode: Motive.
Structure: Impulse.
Position: Wave ((3)).
Direction Next higher Degrees: Wave a.
Wave cancel invalid level:
Details: The current structure of XRPUSD shows a downward correction in Corrective Wave (a), which still has a chance to move down further.
XRP/ U.S. dollar (XRPUSD) Trading Strategy: XRPUSD is in a wave II structure, which is a corrective wave. After the end of wave I, wave II is expected to form a corrective ABC structure. Currently, the price is in the sub-wave b of this structure. After the end of wave b, the price is expected to correct down to the end of wave c of wave II.
Trading strategies
Buy strategy (long position):
- Wait for the price to adjust down to the support zone of 1.8936 - 1.5370 and look for an opportunity to open a buy position.
Risk management:
- Set Stop Loss below the 1.5000 level.
Ripple Elliott Wave technical analysis [Video]
Author

Peter Mathers
TradingLounge
Peter Mathers started actively trading in 1982. He began his career at Hoei and Shoin, a Japanese futures trading company.


