Quant Price Forecast: QNT tests $80 breakout rally as derivatives activity rises
- Quant is up 5% on Thursday, testing the upside breakout of a symmetrical triangle pattern.
- Data shows an increase in QNT futures Open Interest amid rising whale demand, suggesting intense leverage-linked activity.
- Quant should clear above $80 for an upside breakout rally, with targets extending to $100.

Quant (QNT) extends gains towards $80 on Thursday, testing the upside breakout of a long-standing resistance trendline amid rising leverage-based activity of large wallet investors, commonly called whales. The technical outlook is bullish, and a clear daily close above $80 could lead the way towards a potential target of $100.
Whale and retail demand build for Quant
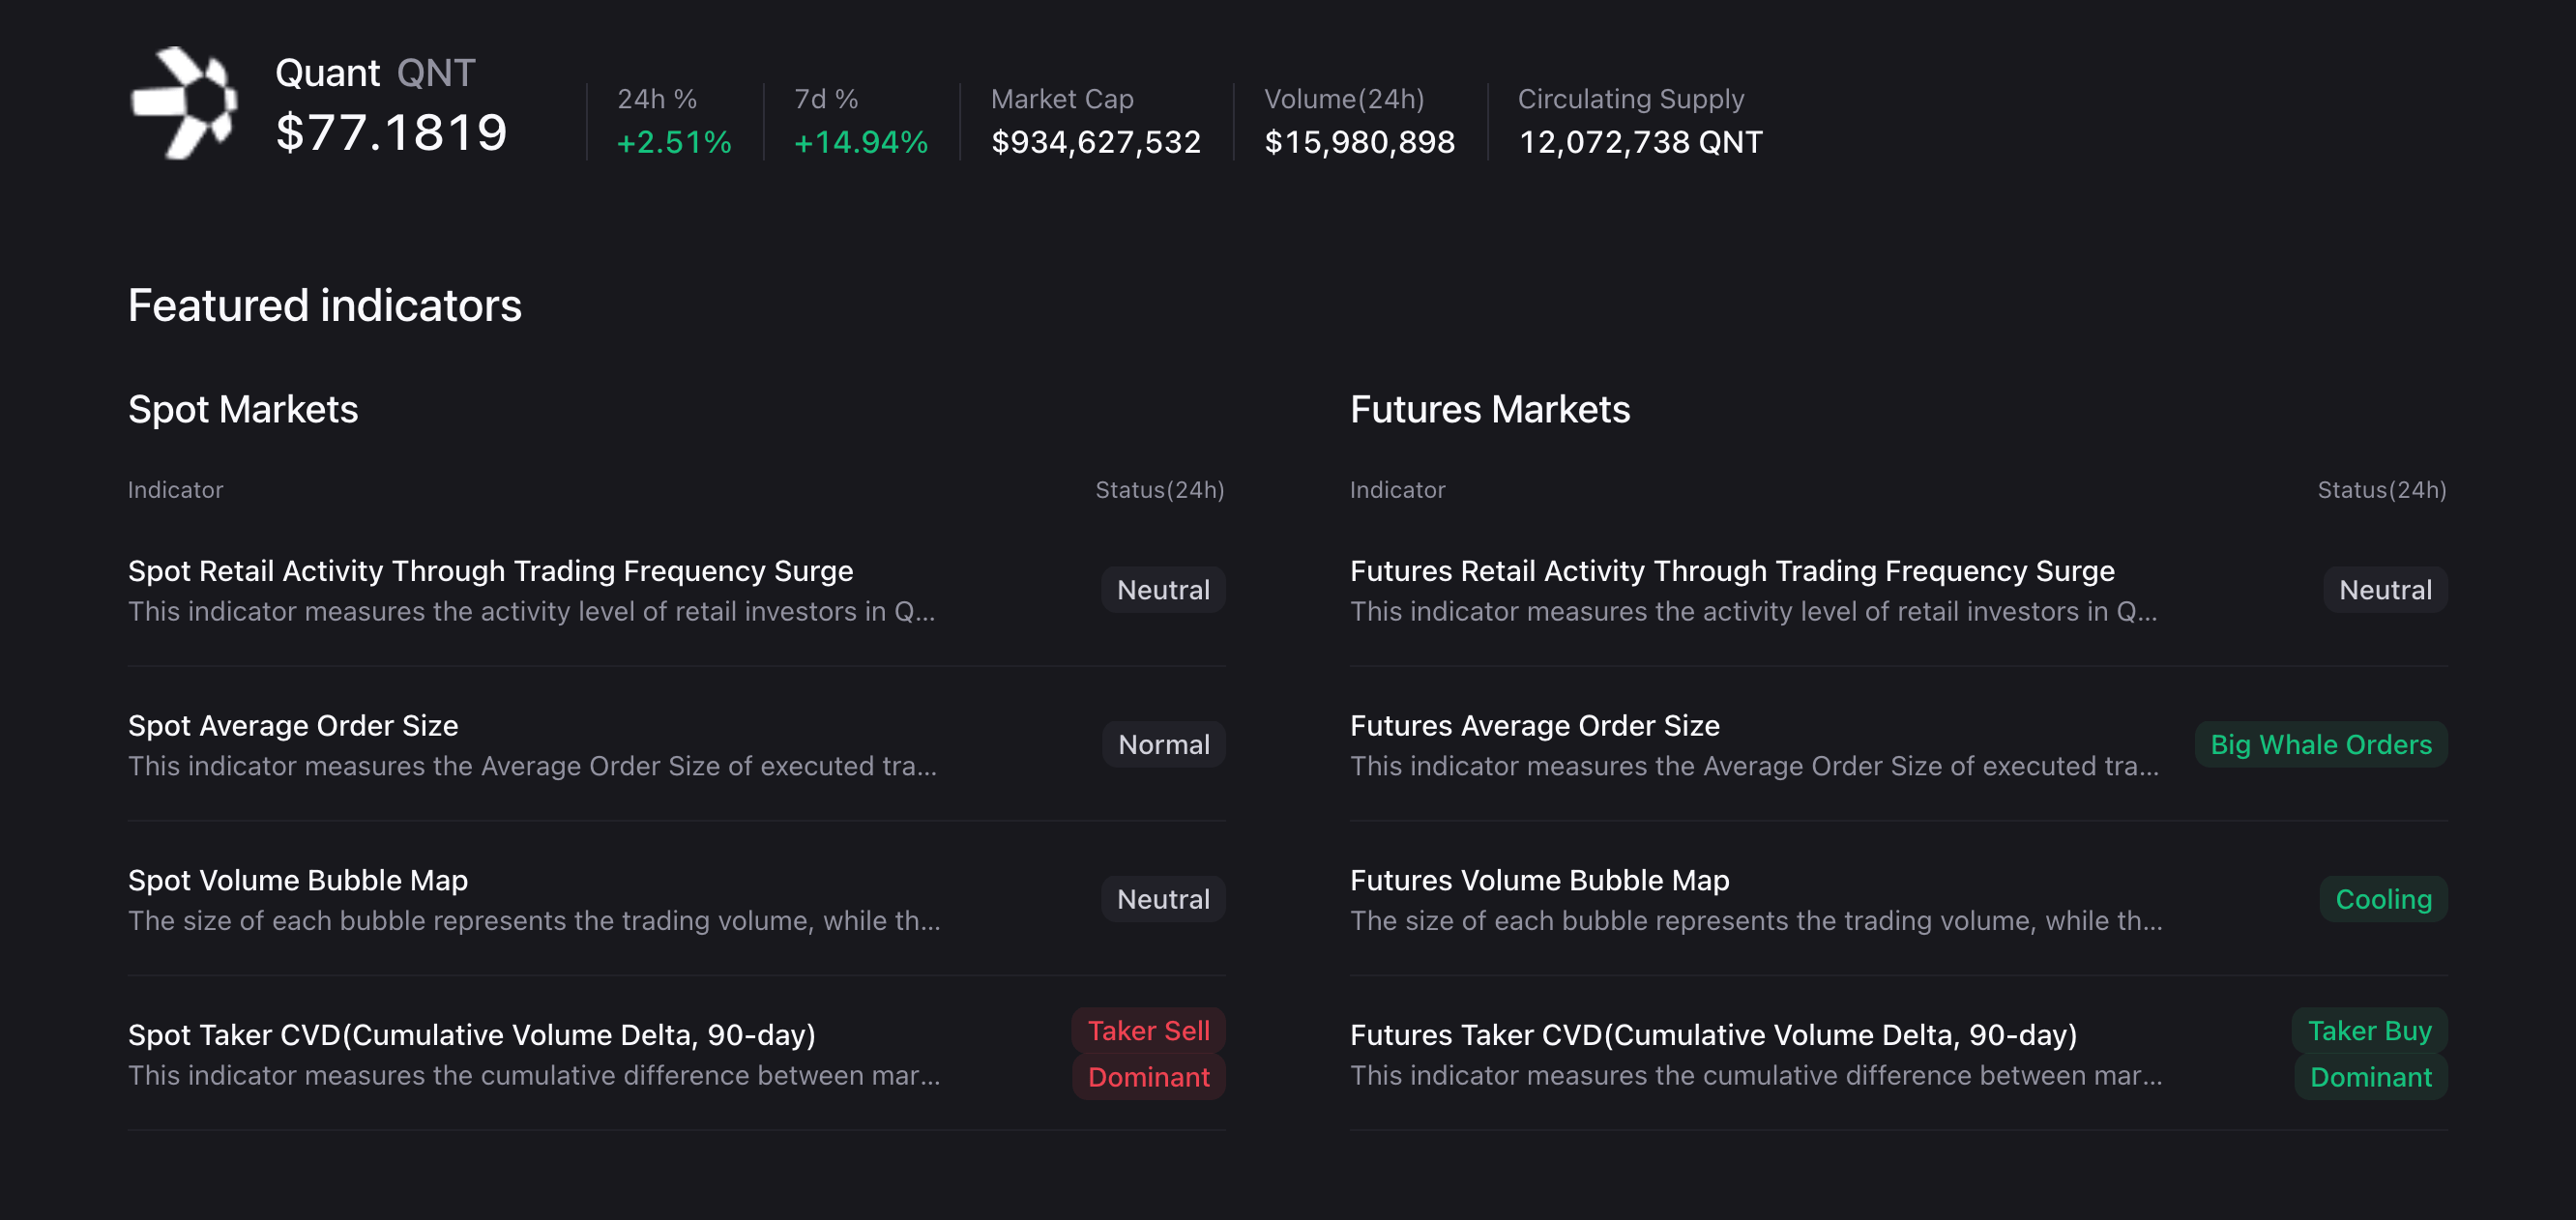
Quant’s steady short-term recovery is driven by increasing demand from both retail and large-wallet investors. CryptoQuant data shows the average order size of executed orders in the leverage market is rising, suggesting increased whale activity. At the same time, the 90-day cumulative volume difference between buy and sell orders reflects a buy dominance.
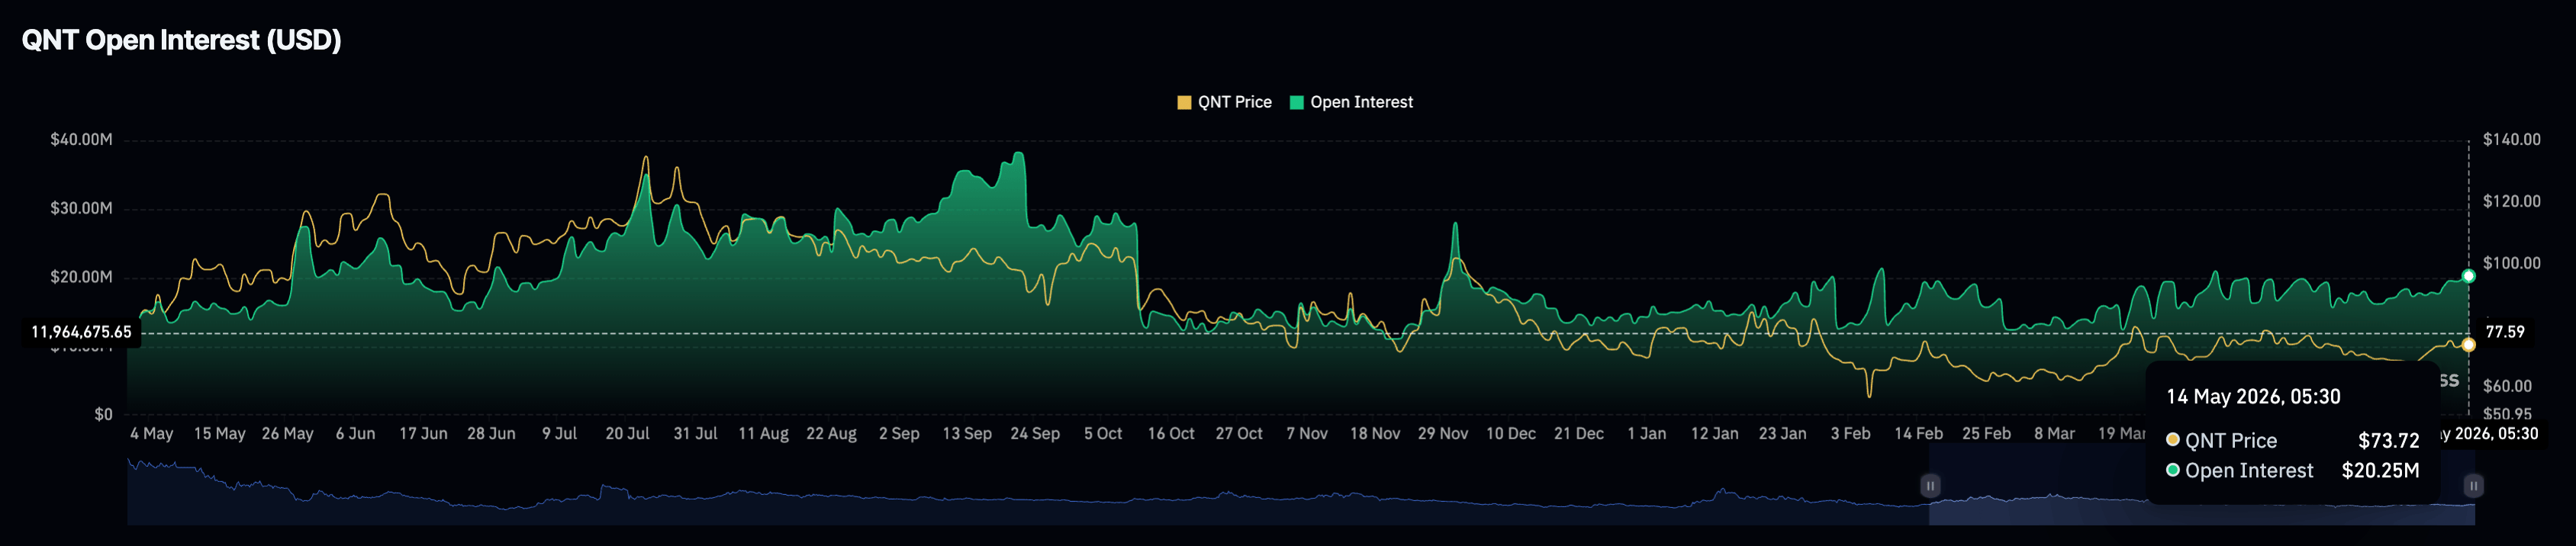
On the other hand, CoinGlass data shows the QNT futures Open Interest (OI) is at $20.25 million, up significantly from $16.96 million on May 1. The steady recovery in QNT futures is gradually approaching the $38.27 million peak from September 21.
Technical outlook: Will Quant price hit $100?
Quant shows 5% gains at press time on Thursday, above its 50-day Exponential Moving Average (EMA) near $72.03. QNT maintains a constructive near-term bias as price tests the 200-day EMA at about $77.52, near an overhead resistance trendline and the 78.6% Fibonacci retracement at roughly $79.35, measured over the downswing from $88.30 to $53.60.
The Moving Average Convergence Divergence (MACD) histogram is positive, with the MACD line above its signal and both crossing above zero. The Relative Strength Index (RSI) hovers around 64 andsuggests firm bullish momentum, though edging toward overbought territory as price approaches the confluence of higher resistance levels.
On the topside, a decisive close above the descending trendline break level near $77.89 would confirm the triangle pattern breakout on the daily chart. The breakout rally would open the way toward the $88.30 swing high, followed by the 127.2% Fibonacci extension level at $101.14.
On the downside, initial support is located at the 50-day EMA near $72.03. A deeper pullback would eye the 50% retracement at roughly $68.79 and the former rising trendline region around $67.86, ahead of the 38.2% retracement near $66.86.
(The technical analysis of this story was written with the help of an AI tool.)
Author

Vishal Dixit
FXStreet
Vishal Dixit holds a B.Sc. in Chemistry from Wilson College but found his true calling in the world of crypto.




